Learn everything about Orderflow trading?
- theforexscalper

Support and resistance levels are points in the market where the price has a high probability of reversing. Knowing where these levels form and the reason why they form. Can help you in predicting when the price is likely to reverse and start moving in the opposite direction.
I always start drawing my support and resistance levels on the linechart.
Because I think that I have more overview where the levels are exactly.
Below you can see an example of a line chart and how I determine my support and resistance levels on this line chart.
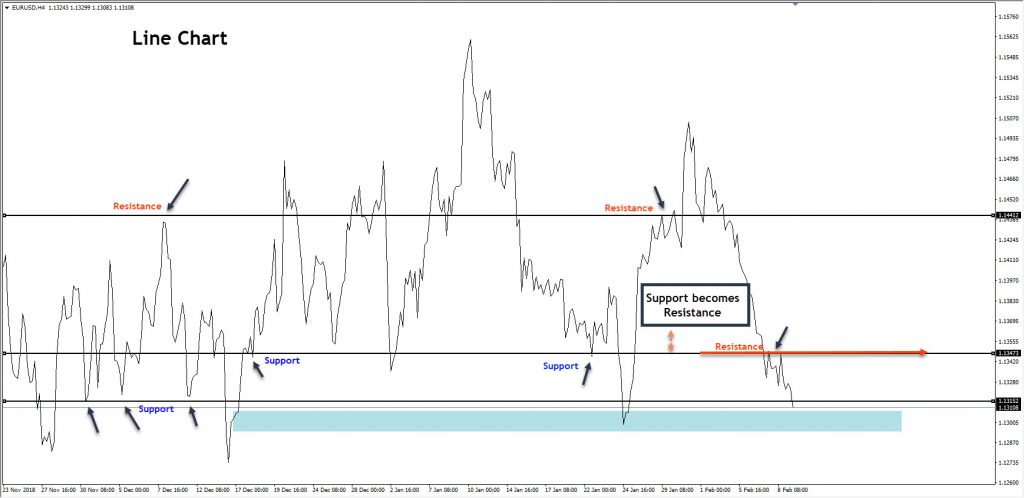
The Support and resistance levels get their name from what they’re expected to cause the market to do upon being reached. Support levels are supposed to support the market and stop it from moving lower. Whilst resistance levels are supposed to stop the market from moving higher. Thus causing it to resist higher prices. Because support and resistance levels cause the market to do different things. It means they always form either above or below the current market price.
Now look at the example below.
Now that I have changed the Linechart in the candlestickchart you see it all a bit better.
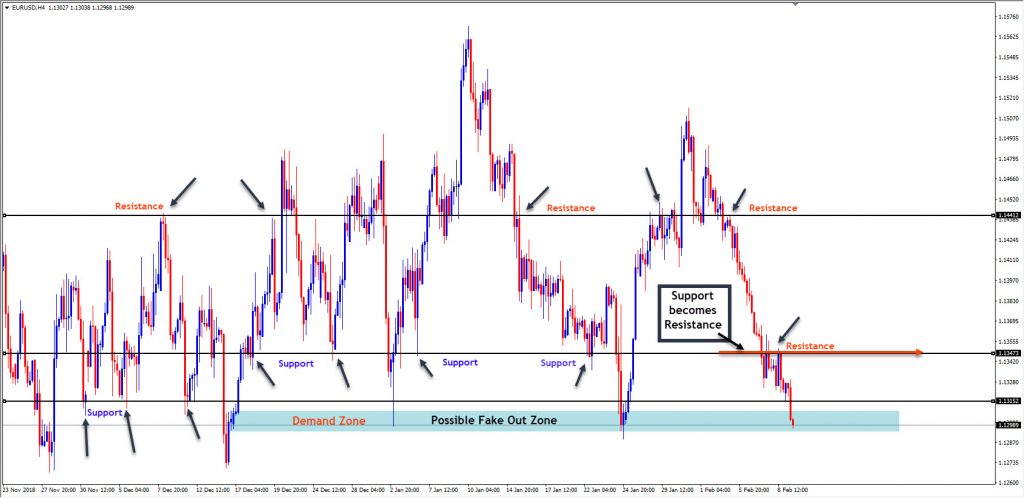
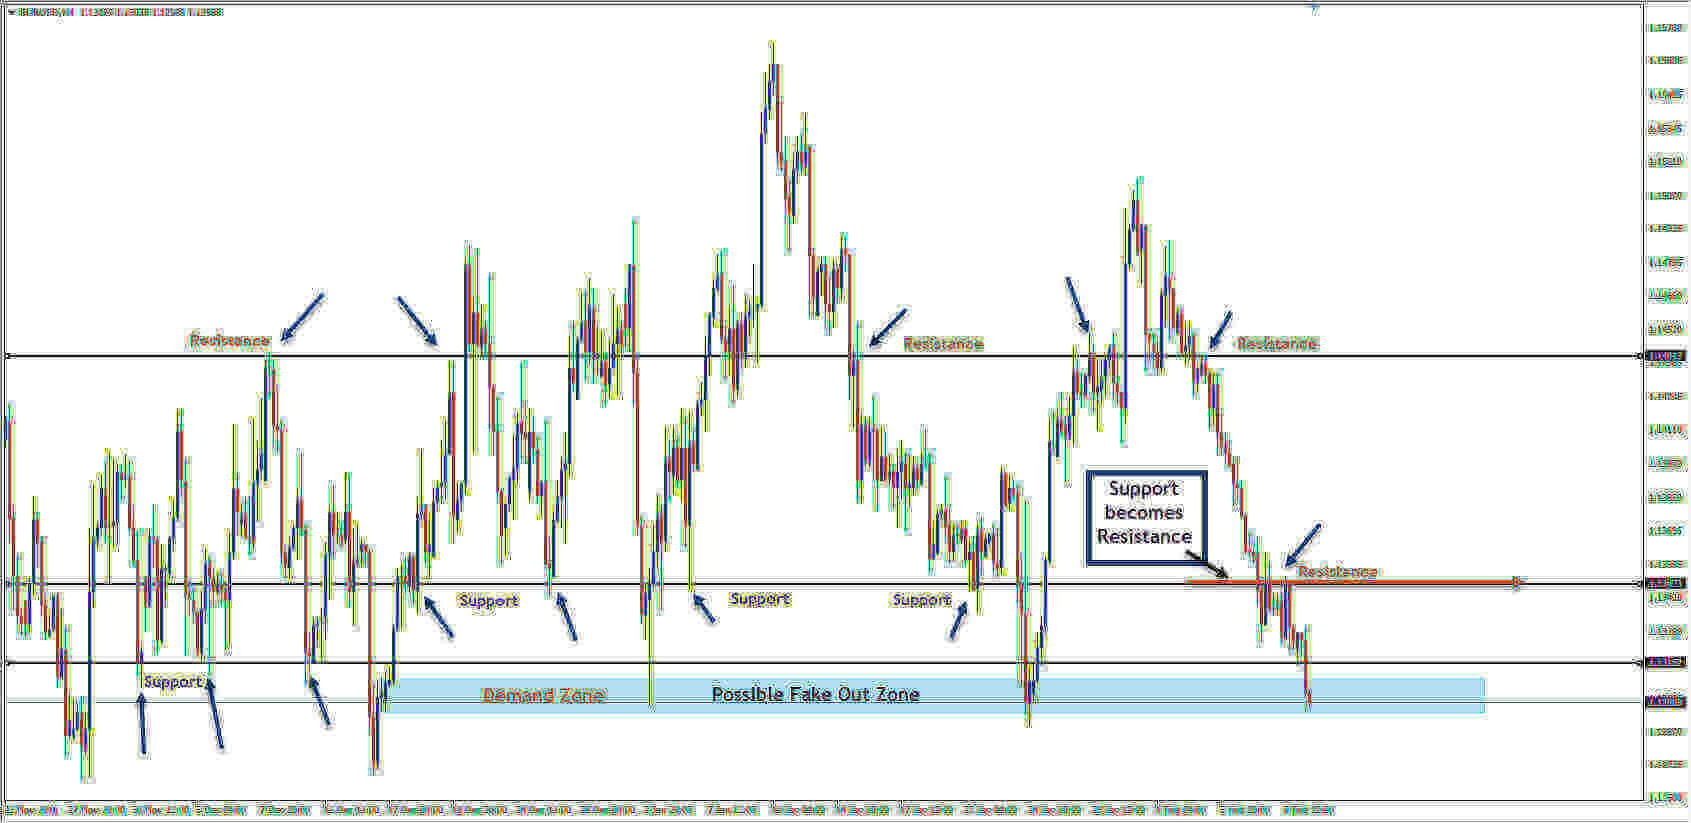
We know for sure that these levels are actually support and resistance levels. Because they all caused multiple reversals to take place. And we know that they are specifically resistance levels due to the way they are all found above the current market price.
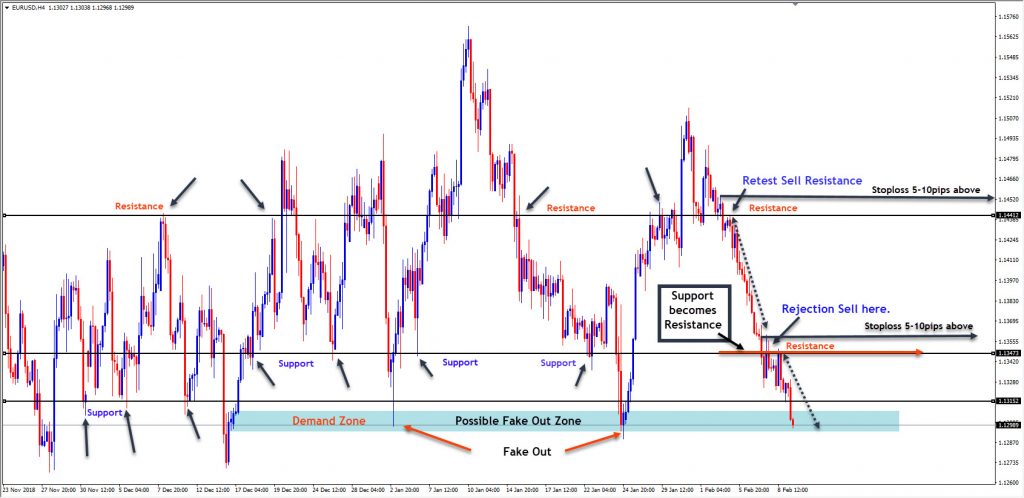
In combination with reading the candlesticks, understanding what a fake out is and how you can recognize it. If you understand what a retest is, and ofcourse good risk managment you can be successful with this strategy.
I have outlined the above chart for you.
Especially in the way I view the market and act on it.
Take advantage of it and keep practicing to read the market perfectly.
Just like you will do with a good book.
Looking for good Forex education? Look at www.theforexscalpers.com
The best Broker? Look at IC MARKETS.


Welcome to my author blog. With over 12 years of experience in the financial markets, Trading is more than a profession for me; it's a passion that has fueled my curiosity and determination. Over the years, I've explored various trading strategies, dabbled in different asset classes, and navigated through the ever-evolving landscape of technology and innovation. Through it all, I've witnessed firsthand the transformation of the financial industry. My mission is to share the wealth of knowledge I've gained over the years with you, my fellow traders and aspiring investors. Whether you're a seasoned pro looking for fresh perspectives or a newcomer eager to understand the basics, you'll find something valuable here.


11 Replies to “Support and Resistance – The Forex Scalper”
True that and I just performed it exactly the way you did it it’s so powerful… thank you
obrigado Kev, por passar seus conhecimentos à quem precisa