
How to draw resistance and support?
Understanding Resistance and Support in Technical Analysis
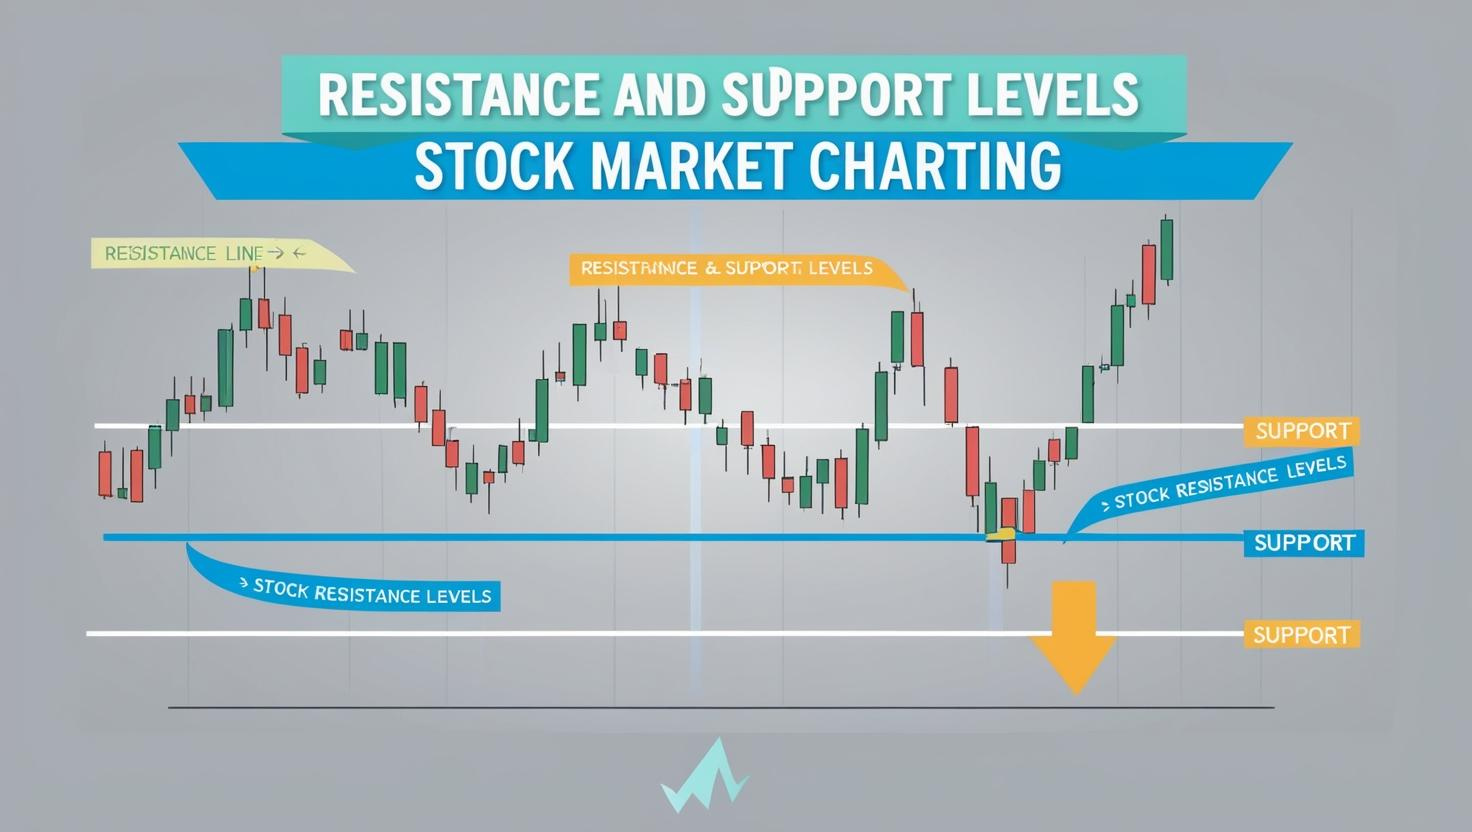
Support and resistance levels are fundamental concepts in technical analysis that help traders identify potential price reversal zones. These levels act as psychological barriers where buying and selling pressures meet, thereby influencing market direction.
How to draw resistance and support?
What is Support in Trading?
Support is a price level where a downtrend pauses due to a concentration of demand. When the price reaches this level, buyers typically step in, thus preventing further decline. If the price breaks below support, it may continue to fall until a new support level forms.
What is Resistance in Technical Analysis?
Resistance is a price level where an uptrend stalls due to selling pressure. At this level, sellers often enter the market, thereby preventing further price increases. If the price breaks above resistance, it may continue to rise until encountering another resistance level.
Step-by-Step Guide on How to Draw Resistance and Support Levels
1. Identify Key Swing Highs and Lows
The first step in drawing support and resistance is to locate historical price points where the market has reversed multiple times. Look for:
- Peaks and troughs on price charts
- Areas where price has reacted significantly in the past
2. Use Horizontal Lines How to draw resistance and support?
Once you’ve identified key swing highs (resistance) and lows (support), you should draw horizontal lines at these points. These lines represent zones where price is likely to react again.
3. Consider Psychological Price Levels – How to draw resistance and support?
Traders often react to round numbers (e.g., 100, 500, 1000), making these psychological price points potential support and resistance levels.
4. Apply Moving Averages for Dynamic Levels
Moving averages, such as the 50-day or 200-day moving average, can also act as dynamic support and resistance levels, especially in trending markets.
5. Use Multiple Timeframes
Since higher timeframes (daily, weekly) provide stronger support and resistance levels compared to lower timeframes (15-minute, 1-hour), it is always beneficial to check multiple timeframes to validate levels.
6. Confirm with Volume Analysis
High trading volume near a support or resistance level increases its significance. If price approaches a level with low volume, then it is more likely to break.
Common Mistakes When Drawing Support and Resistance Zones
– Drawing Too Many Lines
Avoid cluttering your chart with excessive levels. Instead, focus on major price points that have shown strong reactions.
– Ignoring Retests
When a support level turns into resistance (or vice versa), it strengthens the validity of the level.
– Not Adjusting for Market Conditions
Since markets evolve, support and resistance levels shift over time. Therefore, you should regularly update your charts to reflect current conditions.
Key Takeaways on Drawing Support and Resistance
Drawing support and resistance levels is an essential skill for traders. By identifying key price levels, using horizontal lines, considering psychological price points, and validating with volume, you can significantly improve your market analysis. Mastering these techniques will, in turn, enhance your ability to make informed trading decisions and manage risk effectively.
For a more in-depth understanding of support and resistance, consider enrolling in the Supply & Demand Trading Masterclass.
trading execution, we highly recommend using IC Markets, a reliable broker for forex and CFD trading.
a deeper dive into order flow trading, be sure to check out the Orderflow Trading Masterclass.
Keywords: resistance drawing, how to draw resistance and support