Learn everything about Orderflow trading?
- theforexscalper

Traders looking to get an edge in the market. Whether you’re just starting out or you’ve been trading for a while, this guide will shed light on how footprint charts can help you see the market in a new way.
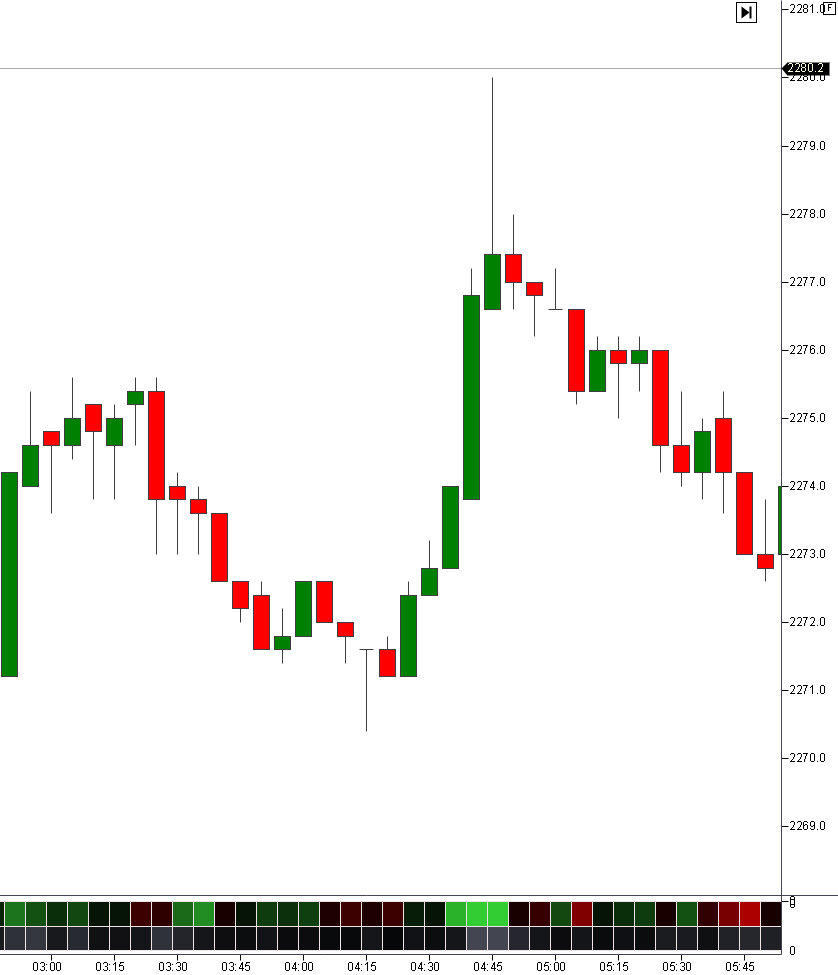
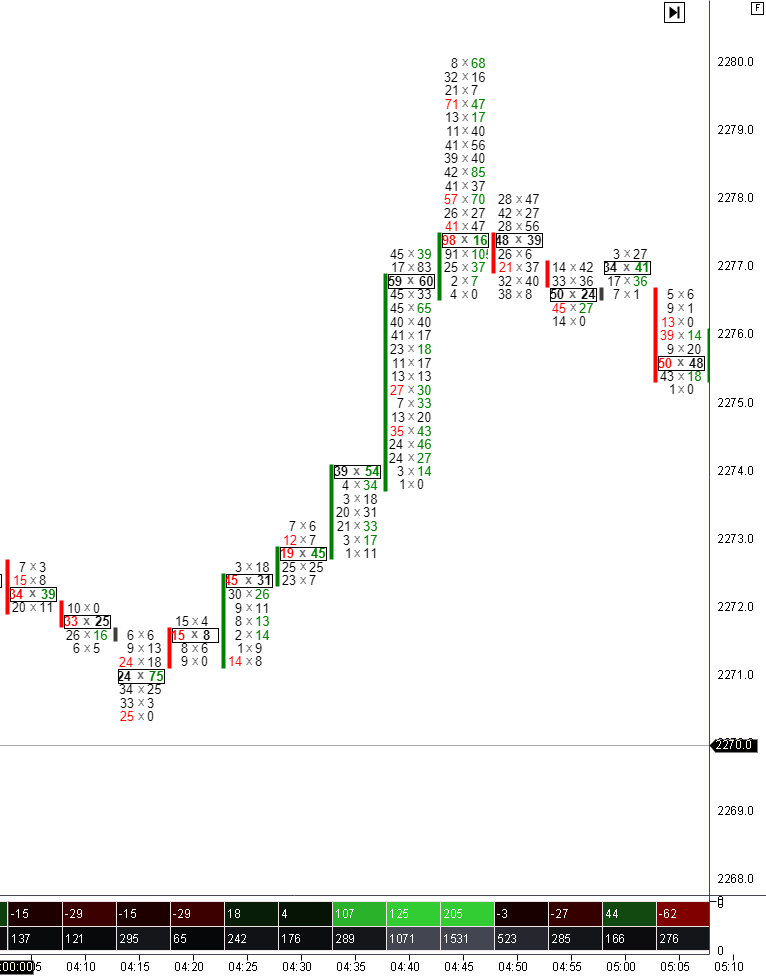
Think of footprint charts like a detailed map that shows not just the roads (or in trading terms, the price changes) but also the traffic on those roads (the volume of trades happening). Unlike traditional charts that only tell you the price moved, footprint charts show you how many trades happened at each price level, giving you a clear picture of where buyers and sellers are most active.
Knowing where the market is heading is key to making smart trading decisions. Traders who can spot changes in market direction early on can manage their risks better and have a better chance of making profitable trades. This is where footprint charts come into play. They offer a real-time glimpse into market activity, showing you exactly where supply (sellers) and demand (buyers) are at any given moment.
Footprint charts are a window into the market’s soul, showing you the push and pull of supply and demand as it happens. They provide a wealth of information, including:
By studying this information, traders can make more informed decisions, spotting opportunities that others might miss.
Footprint chart offer a detailed view of market activity, allowing traders to make smarter decisions based on real-time data. By understanding the flow of orders and how it affects price levels, traders can better predict market movements and improve their trading results. Remember, the right charting platform and a solid understanding of footprint charts can be your best allies in navigating the complexities of trading.
Joining our community opens the door to a network of enthusiastic traders, all focused on mutual success. Our exclusive members-only Slack channel is your arena for exchanging ideas, dissecting market trends, and fostering collaborations. That can turn trading visions into reality.
Don’t let another moment pass in hesitation. Embark on your journey to trading excellence today by enrolling in our courses. It’s time to transform your trading dreams into your reality.
Join our courses and community today and take your skills to the next level!
Elevate Your Trading with ATAS.
So for those dedicated to mastering the art of futures trading, ATAS is more than a platform. It’s a partner in your journey towards trading excellence. Its blend of sophisticated analysis tools, customizable features, and supportive community. This makes ATAS the recommended choice for traders aiming to leverage the full potential of the futures market.


Welcome to my author blog. With over 12 years of experience in the financial markets, Trading is more than a profession for me; it's a passion that has fueled my curiosity and determination. Over the years, I've explored various trading strategies, dabbled in different asset classes, and navigated through the ever-evolving landscape of technology and innovation. Through it all, I've witnessed firsthand the transformation of the financial industry. My mission is to share the wealth of knowledge I've gained over the years with you, my fellow traders and aspiring investors. Whether you're a seasoned pro looking for fresh perspectives or a newcomer eager to understand the basics, you'll find something valuable here.


One Reply to “Footprint Charts: A Simple Guide.”
I want to learn how footprint charts work