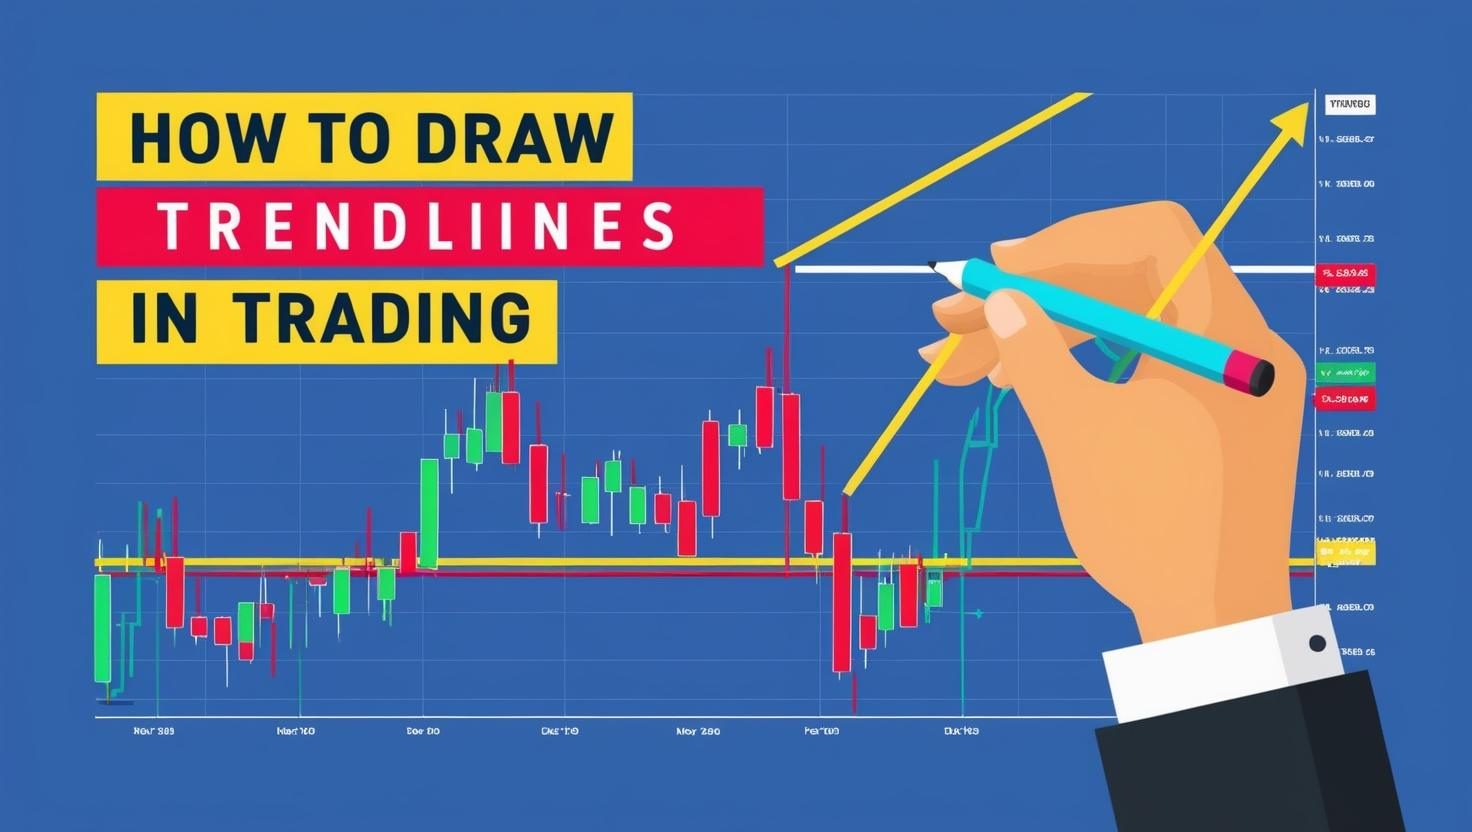
How to Draw Trendlines? Trendline Trading.
Understanding How to Draw Trendlines in Trading and Technical Charting
Trendlines are essential tools in technical analysis for traders who want to master how to draw trendlines, helping traders identify market trends and potential entry and exit points. By drawing trendlines accurately, traders can significantly improve their decision-making and, as a result, enhance their overall trading performance.
What Are Trendlines and How to Draw Trendlines for Trading Success?
Trendlines, a crucial aspect of how to draw trendlines, are diagonal lines drawn on a price chart to connect significant price points. They help traders visualize the market’s direction and, consequently, identify potential support and resistance levels within a trend.
Types of Trendlines and How to Draw Trendlines Effectively in Trading
1. Uptrend Lines How to Draw Trendlines?
An uptrend line is drawn by connecting a series of higher lows. It clearly indicates that the market is in a bullish phase, with buyers dominating and consistently pushing prices higher. Therefore, traders look for buying opportunities when the price approaches the trendline.
2. Downtrend Lines
A downtrend line is drawn by connecting a series of lower highs. This signals a bearish market, where sellers are in control, causing prices to steadily decline. As a result, traders often consider selling opportunities when the price touches the trendline.
3. Sideways Trend Lines
When the price moves within a range without clear higher highs or lower lows, a horizontal trendline can help traders identify potential breakout zones. Consequently, traders wait for a breakout before making a move.
Step-by-Step Guide on How to Draw Trendlines for Precise Market Analysis – How to Draw Trendlines?
1. Identify Key Price Points
To begin, look for at least two significant swing highs or swing lows. The more touchpoints a trendline has, the greater its validity, and thus, the more reliable it becomes.
2. Use a Consistent Timeframe
Trendlines drawn on higher timeframes (daily, weekly) tend to hold more significance than those on lower timeframes (15-minute, 1-hour). Therefore, choosing the right timeframe is crucial in ensuring accurate analysis.
3. Draw the Line with Precision
Use a straight line tool to connect at least two key price points. Additionally, the line should extend into the future to provide guidance for potential price movements, making it easier to anticipate future trends.
4. Validate with Multiple Touches
A trendline becomes much stronger and more reliable when price respects it multiple times. Consequently, traders should look for multiple confirmations before relying on a trendline.
5. Adjust as the Market Evolves
Since market conditions frequently change, trendlines should be adjusted accordingly to maintain the accuracy of how to draw trendlines to reflect the latest price movements. By doing so, traders can ensure their analysis remains accurate and up-to-date.
Effective Trading Strategies Using Trendlines for Market Trends
– Breakout Trading
When the price breaks a trendline with high volume, it can signal a potential trend reversal or continuation, which traders can take advantage of. Therefore, traders often wait for confirmation before entering a trade.
– Pullback Trading
Traders often wait for the price to retest a broken trendline before entering a trade, as this helps confirm the breakout and increases confidence in the trade. Consequently, pullback trading can provide better risk-reward ratios.
– Combining with Other Indicators
Trendlines work best when combined with indicators like moving averages, reinforcing the understanding of how to draw trendlines accurately, RSI, or Fibonacci retracements for additional confirmation and accuracy. As a result, traders can make more informed decisions.
Common Mistakes to Avoid When Learning How to Draw Trendlines for Trading
– Forcing a Trendline
Avoid adjusting trendlines just to fit the price action. Instead, trendlines should naturally follow the market rather than conforming to a trader’s bias. Therefore, always ensure trendlines are drawn objectively.
– Using Only Two Points
Although two points can establish a trendline, it’s far more reliable when confirmed with three or more touches. This additional confirmation helps traders avoid false signals.
– Ignoring Market Context
Always consider the broader market structure. Trendlines should align with overall price patterns, volume activity, and other supporting indicators. By doing so, traders can improve the accuracy of their analysis.
Final Insights on How to Draw Trendlines and Enhance Trading Strategies
Mastering trendlines is crucial for successful trading, especially for traders who want to learn how to draw trendlines effectively. By identifying key price points, maintaining precision, and combining trendlines with other analysis tools, traders can gain a significant edge in the markets. Whether you’re trading forex, stocks, or cryptocurrencies, trendlines provide much-needed structure and clarity in an often chaotic market environment. Consequently, learning to draw and trade using trendlines effectively can enhance trading success.
For a deeper dive into trading techniques, consider enrolling in the Supply & Demand Trading Masterclass.
For an advanced understanding of order flow trading, be sure to check out the Orderflow Trading Masterclass.
Keywords: trading lines, trading trend lines, trendline trading, how to draw trend lines, how to draw trendlines, draw and trade, trading drawing


