
Moving Average Chart: A Key Tool for Traders!
A moving average chart is among the most widely used technical indicators in stock trading. It assists traders in identifying trends, smoothing out price fluctuations, and making well-informed decisions based on historical data. Whether you are a beginner or an experienced trader, grasping how to utilize a stock moving average chart can significantly improve your trading strategy.
What Is a Moving Average Chart?
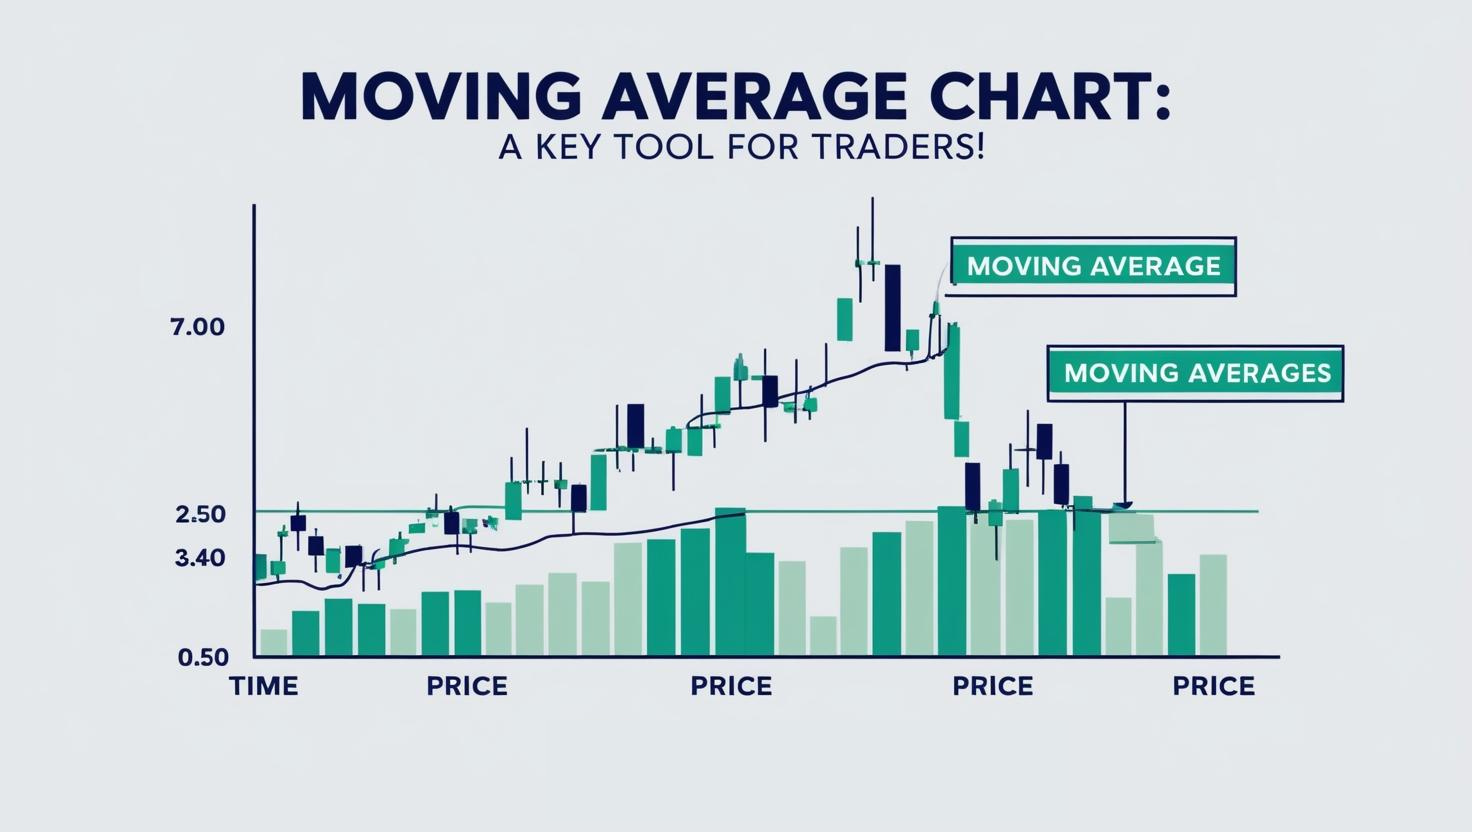
A moving average chart visually represents price trends in the stock market. It calculates the average price of a stock over a specified period and then plots it as a line on the chart. This approach helps smooth out short-term fluctuations, making trends easier to recognize.
There are two main types of moving averages:
- Simple Moving Average (SMA) – Calculated by summing the closing prices of a stock over a set period and then dividing the total by the number of periods.
- Exponential Moving Average (EMA) – Assigns more weight to recent prices, making it more responsive to price changes compared to the SMA.
How to Read a Stock Moving Average Chart
To effectively interpret a stock moving average chart, traders analyze different moving averages together to determine market trends:
- Short-term moving averages (e.g., 10-day, 20-day SMA/EMA) – Indicate recent price trends and often help identify entry and exit points.
- Medium-term moving averages (e.g., 50-day SMA/EMA) – Assist traders in spotting intermediate trends and confirming trend reversals.
- Long-term moving averages (e.g., 100-day, 200-day SMA/EMA) – Offer a broader perspective on market direction and are crucial for long-term investors.
The Importance of Moving Average Crossovers
One of the most effective techniques for utilizing a moving average chart involves analyzing crossovers:
- Golden Cross: Occurs when a short-term moving average (e.g., 50-day SMA) moves above a long-term moving average (e.g., 200-day SMA). This signals a potential uptrend and is a bullish indicator.
- Death Cross: Happens when a short-term moving average moves below a long-term moving average. This suggests a potential downtrend and is a bearish indicator.
Using Moving Average Charts in Trading Strategies
A moving average chart integrates seamlessly into various trading strategies:
- Trend Following Strategy – Traders rely on moving averages to verify whether a stock is in an uptrend or downtrend before making trading decisions.
- Support and Resistance – Moving averages frequently act as dynamic support and resistance levels where prices tend to bounce off.
- Moving Average Ribbon – Involves using multiple moving averages of different timeframes to gauge the strength of a trend.
Additional Resources
For traders eager to enhance their knowledge of supply and demand trading, explore our Supply and Demand Trading Masterclass: Enroll Here.
If you’re in search of a reliable broker to execute your trading strategies, consider IC Markets: Sign Up Here.
Conclusion
A stock moving average chart serves as a powerful tool that enhances clarity in analyzing stock price movements. By understanding the various types of moving averages, crossovers, and trading strategies, traders can make more informed decisions. Whether you are day trading or investing for the long term, mastering the moving average chart can provide a significant edge in the market.
Are you incorporating moving averages into your trading strategy? Share your thoughts in the comments below!