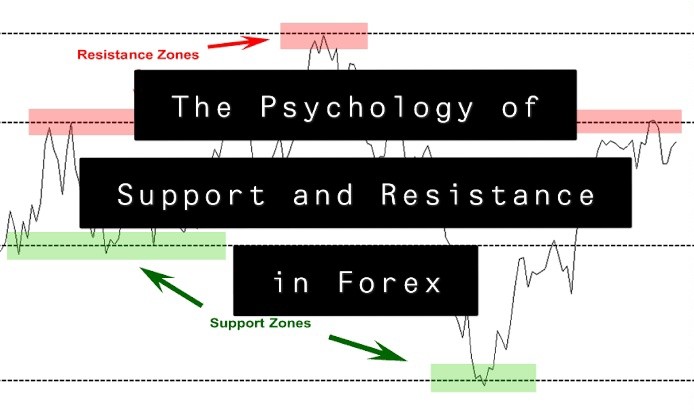
The method of finding support and level of resistance is one of the most important skills in forex trading for retail trader. This is so because learning the fundamentals of support and resistance will boost every method of trading. Support and resistance are different rates or areas on the trade chart, where a forex pair ‘s price would likely find opposition. The reason for this is that these are mental levels which show the market players’ different attitudes.
The cause that support and resistance work and the price can continue to hit and bounce off them is due to forex market participants’ psychology. There’s no magic, nothing more than common sense. One explanation of why it works so well is to think of the market traders’ psychology. Now there are many reasons traders are going to buy or sell, but they are usually driven by the profit motive either positioning themselves to make more money, or trying to ease the pain of losing money for a trade they’ve already taken out.
It’s a common thought that there’s only one kind of support and resistance and that’s just one thing that happens, the price. While lines of support and resistance are important regardless of the quality, some prices are more important than others. These lines of support and resistance are what are called levels of psychological support and resistance. Psychological support and lines of resistance emerge not because of the perceived value of a specific price to a currency pair, stock, bond, or security, but because it is a relevant “psychologically” number.
Psychological levels are price levels that tend to attract considerable attention from the consumer, and usually see a price reaction when checked. Fear, greed and herd instinct are terms that often come up when the financial markets are discussed. That’s because human emotions and behaviors are largely responsible for market price moves. Thus, a price chart can be seen as a graphical representation of emotions such as fear, greed, optimism and pessimism, and human behavior, such as herd instinct. The price charts show how market participants are reacting to future expectations.


