2. Order flow footprint.
What is Order flow footprint?
The Order flow footprint charts are currently becoming increasingly popular with traders.
With the footprint chart you can look into the candle.
Normally we see a candle, but we do not know what exactly happened there, so with a footprint charts you have the exact numbers in the candle.
The original footprint charts were developed by Market Delta in 2003.
Unfortunately they are no longer active after a bankruptcy in 2020, but luckily we can still find enough about trading the footprint charts everywhere.
You will find it under many different names such as Numbered bars, Bid and Ask, Cluster and so on.
The name may therefore differ, but the concept remains the same.
But what exactly does the Order flow footprint chart show us?
The footprint charts show us the volume traded at that price level.
Compared to other indicators that traders use, the footprint chart is based on real-time information.
That is why we can find strong information on which levels buyers and sellers were interested.
Where absorption took place and where exactly the most volume took place.
Why trade with footprint?
I think that trading with the footprint charts can be very good for an extra confirmation in addition to your trading strategy.
And I also think that you should not start with the Order flow footprint charts if you do not have enough experience trading Supply and Demand or any strategy.
This can cause a lot of confusion otherwise.
As I already mentioned, the footprint charts offer an inside look into the market and show where participants are trapped or anticipate breakouts.
So we can get a lot more information with this, especially with regard to possible entries and when you can best exit a trade.
It can also help to make your Stop loss even tighter so that your win rate becomes much better.
How exactly this all works and how you can read and see this is too much to explain here now, but I explain all that in my course.
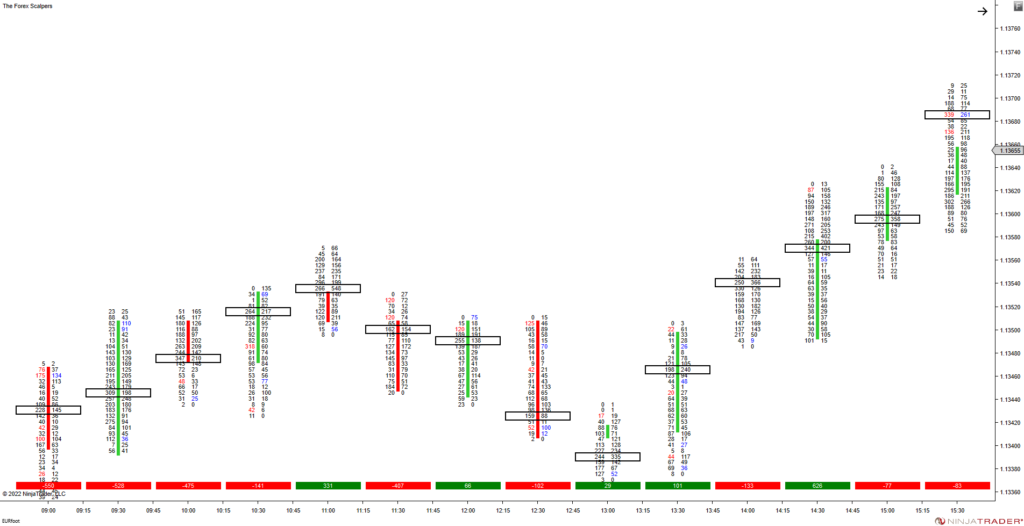
What types of footprint are there?
- Bid/Ask footprint.
I think this is one of the most used Bid/Ask Footprint displays the number of contracts traded on the bid price and the number of contracts traded on the asking price in real time for any periodicity you decide to use. In the example above you see a footprint chart with the Bid/Ask. (Order flow footprint) - Delta footprint.
To be able to use this correctly, you already need some knowledge about delta.
You see only one number because Delta represents the difference between finalized executions at the bid and the offer. - Volume footprint.
This does not show any positive or negative volume but simply shows how much total was traded at that level.
Whether it was Bid or Ask.
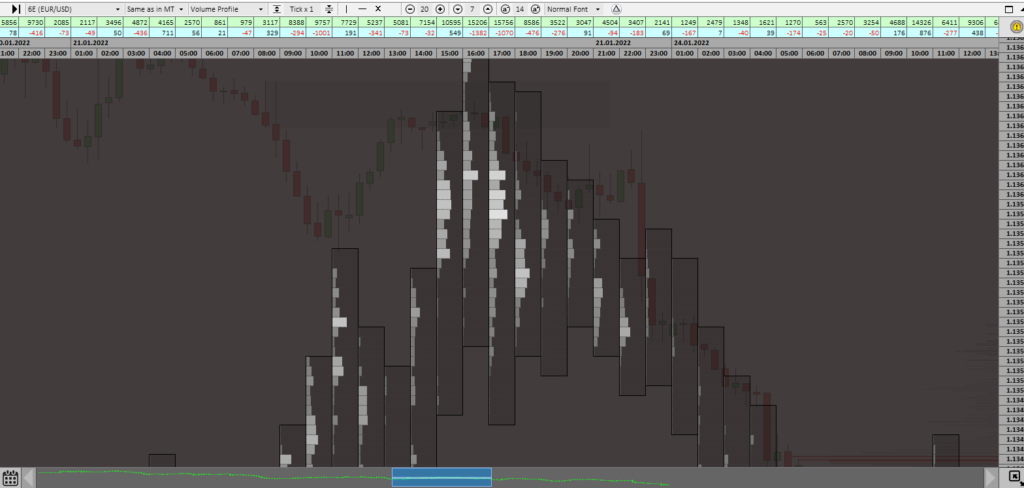
Volume Footprint is useful because it shows where there was and interest from both buyers and sellers. - Volume profile footprint.
The Volume profile footprint is actually not much different, only it shows per candle at which level the most volume was.
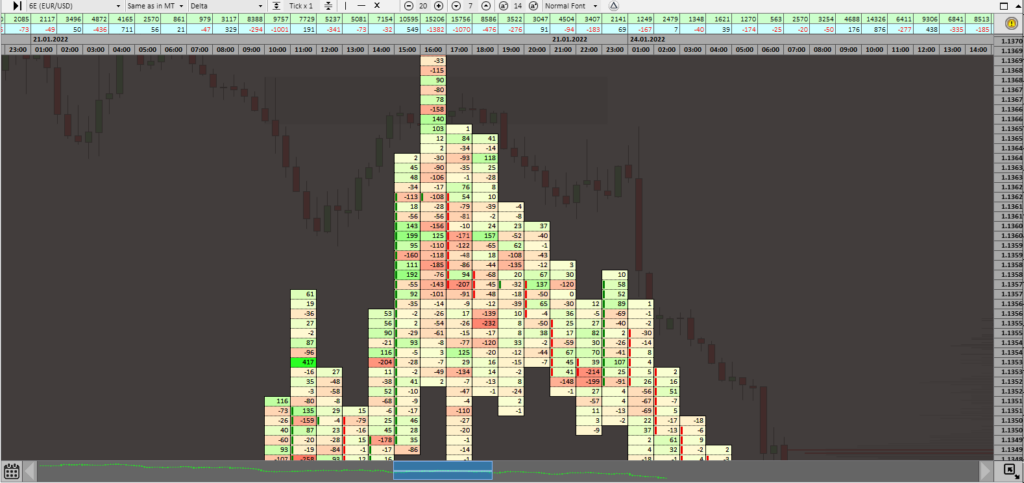
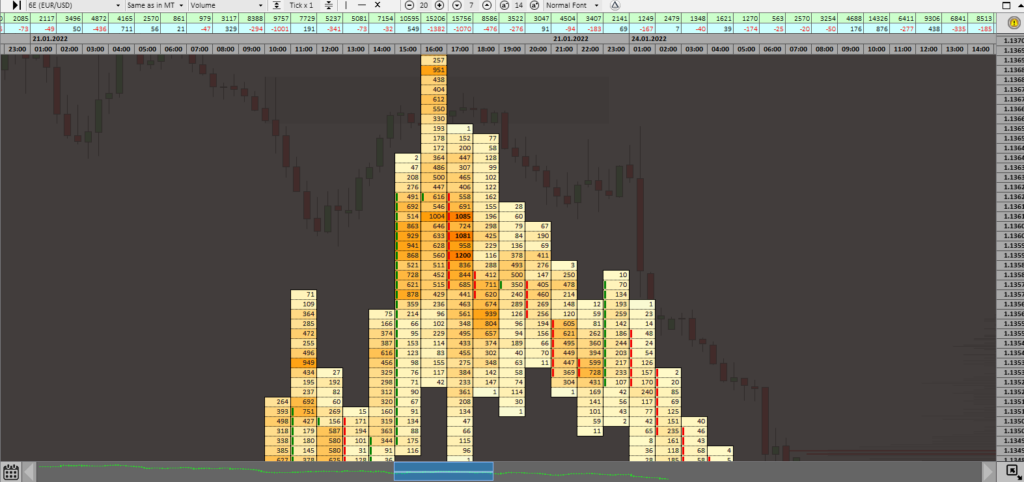
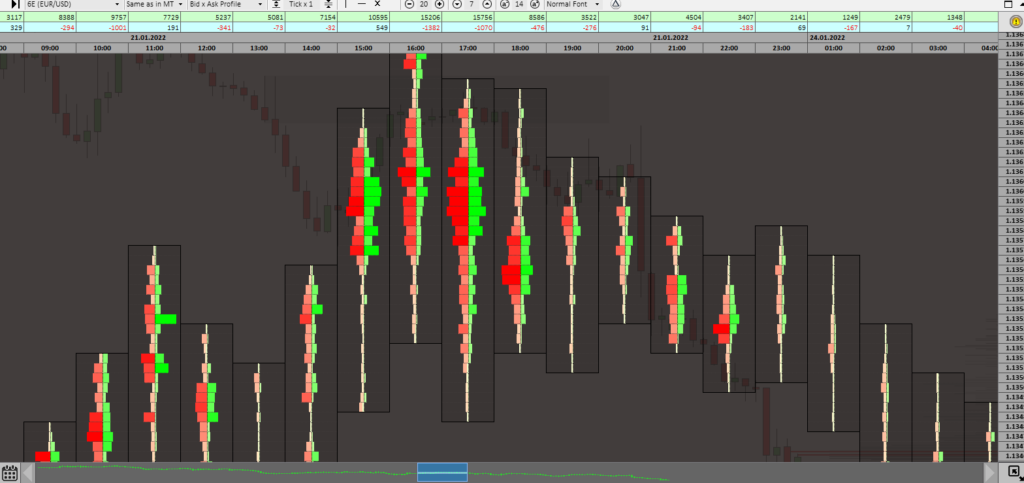
These are some of the most used.
Since I got to know the Order flow trading and the footprint charts.
I don’t really want anything else.
It just gives me more insight into the specific areas and what exactly is happening there.
It helps me to take even tighter and more profitable entries.
But I can also better determine where I should take my profits and where I should place my Stop loss.
Especially if you are a more experienced trader, I will definitely recommend that you delve into this a bit more.
It can certainly help you take your trading to an even higher level!


