In the international forex market, investors, speculators, retailers, and banks determine the relative value of exchanging currencies into another by buying and selling a currency pair. Forex traders use a variety of tools to forecast currency pair movements. Many FX traders depend on news, economic variables and interest rates, while others choose to use charting different tools and indicators to drive their decisions. No matter your trading style, you’ll just need to know how to read the forex market chart.
Charts originated as a tool of financial technical analysts but due to their fast and efficient transmission of useful information about financial market trends, they have found wider use during a time with investors. The most reliable method will be to follow the charts, with several ways for traders to find out how to navigate trends on forex pairs, and also commodities and other instruments. Traders using chats are known as technical traders who tend to monitor charting tools and indicators correctly to define peak movements and price levels as to when to enter and leave markets.
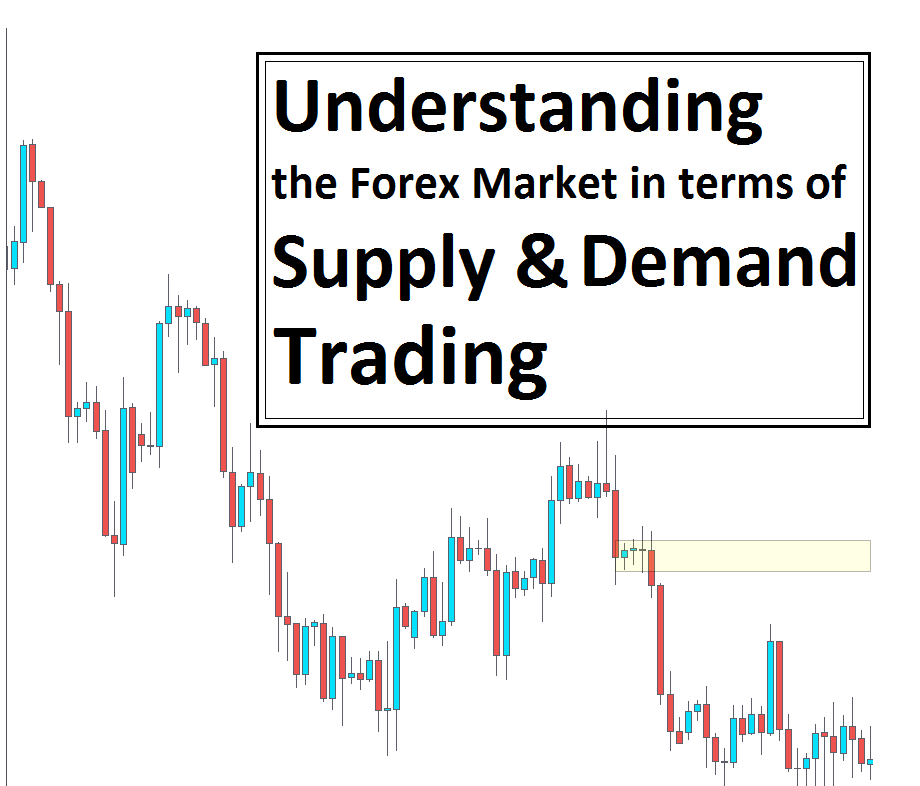
The Forex market chart helps Forex traders to assess Supply and demand, market trends and help them decide where in the future the currency price will be. Traders have built multiple of the different charts to help them make sense of the currency movements represented on a screen. Lots of different types of trading strategies and indicators are being built to cover any aspect of trading, from trend to mean reversal. The capability to understand charts is part of forex trading because it not only helps you to keep track of your active trades but also helps spot supply and demand that is emerging for your potential trades which is very important for the professional trader with trades on supply and demand base.
When you are more comfortable reading and analyzing the charts, you can learn how to use supply and demand zones to analyze market volatility rates and price changes, such as technical analysis. From the Supply and Demand aspect, you can clearly find the supply area mean where to sell and as well you can find the demand area where market traders trying to buy that currency. These technical tools will help you to understand the actual market data that may be missing for some shares, stoke or fx currencies. Essentially, technical indicators and tools inserted into your live trading charts, such as volume measures, trend lines, Moving average, Fibonacci retracement, oscillators, etc providing a clearer view of the forex markets and patterns that lie ahead.


