Double top and double bottom Patterns Chart
The double top and double bottom:
One of the most common chart patterns in Forex Trading is the Double Top/Bottom. This pattern is such a regular customer in the charts that it’s an easy manner of proof to show the Price Action isn’t as wild as many think. The Double Top/Bottom in special represent the re-testing of the highs and lows or better said the Support and Resistance.
-The double top:
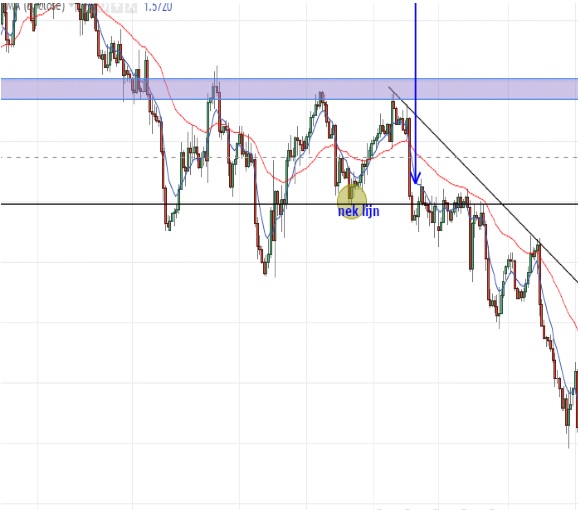
They are mostly found during an uptrend, at the level where new highs are formed. Often followed by a pullback and retest of that same high. When the retest of the first high doesn’t succeed to reach over the price of the first high. So, the price bounces at the Resistance level. Mostly the letter “M” will be formed at the chart.
The second high doesn’t have to be exact under the first high, but has to close to the same level. This pattern mostly indicates a weakened trend. The buyers will lose some ground like shown underneath.
After a confirmation signal for a short trade from the Double Top formation, the neck is used as a target.
Always stay up to date on as well to confirm your decision.
Indicates a “Sell” opportunity
by showing us the price is struggling to break through the roof (Resistance level). The market will go up twice towards that important Resistance level and twice it shows a clear Bearish candlestick formation after. After the first rejection of the key Resistance level, the price will tend to go further down to create the neck. The price will go up for the second time and test out the same Resistance level that is marked as the blue bar underneath. They are good opportunities for a reverse on the weekly and monthly levels of Resistance. Also on the daily and H4.

-The double bottom:
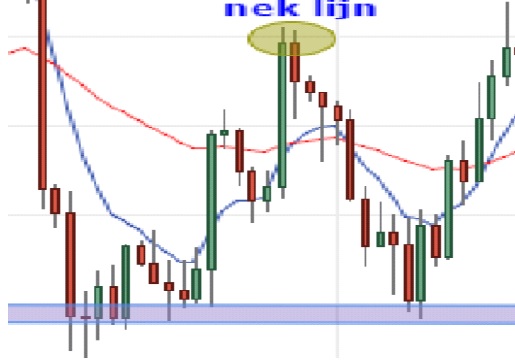
A Double Bottom is the opposite Double Top. As said before, a lot of patterns and formations can be mirrored. It mostly occurs during a downtrend and is a reverse signal telling is the trend could go up. Easy to spot on the charts since it looks like the letter “W”. The initial downwards movement will find a Support at the bottom and will stew the Price Action of the Support towards a new formed high (he middle of the “W”).
Another “Sell” wave happens and touches the same Support level as the first did. And so, lead to another increase of the price. This all is confirmed when the price breaks through the higher Resistance level.
Take look at the chart underneath and you will understand.

These are the most fundamental patterns of Double Tops/Bottoms that can be found at the charts. As you can see, the Support and Resistance levels are extremely important. Especially when trying to recognize patterns and formations. Make sure your charts are clean as well. You don’t want to many distractors. Let’s move towards more advanced Price Action setups with Double Tops and Bottoms surrounded.
The second rejection confirms the Double Bottom formation: Ideal moment to buy or even exit when you’ve been in the “sell”/short action.
Variations:
There are multiple Double Top and Bottom variations possible in the market. The Double Top/Bottom could be seen as a reverse of trend but also as a move of correction towards the ongoing trend as shown below.


Traditional:
Tend to have a bigger chance to break out counter trend wise.
Correctional:
Tend to move on with the ongoing trend. Especially when at the 50% or 61,8% FIB Retracement level (more on that topic later).
Overbalanced:
The correction for this Double Top/Bottom is bigger than the previous correction and so has more potential to reverse counter trend wise.
Running:
These formations will eventually come to a new high or low when a reverse with the ongoing trend occurs. Especially if the Support and Resistance levels are at in the 50% of 61,8% FIB Retracement area.

Reversal and breakout trade:
Mostly when the market has reversed and a Double Bottom appears, you have a change to buy at the first correction. Another chance occurs when the upwards going Price Action movement is more realistic.

Best Broker: IcMarkets.


