Learn everything about Orderflow trading?
- theforexscalper
Learn everything about Orderflow trading?
theforexscalper
Email us now :
info@theforexscalpers.com

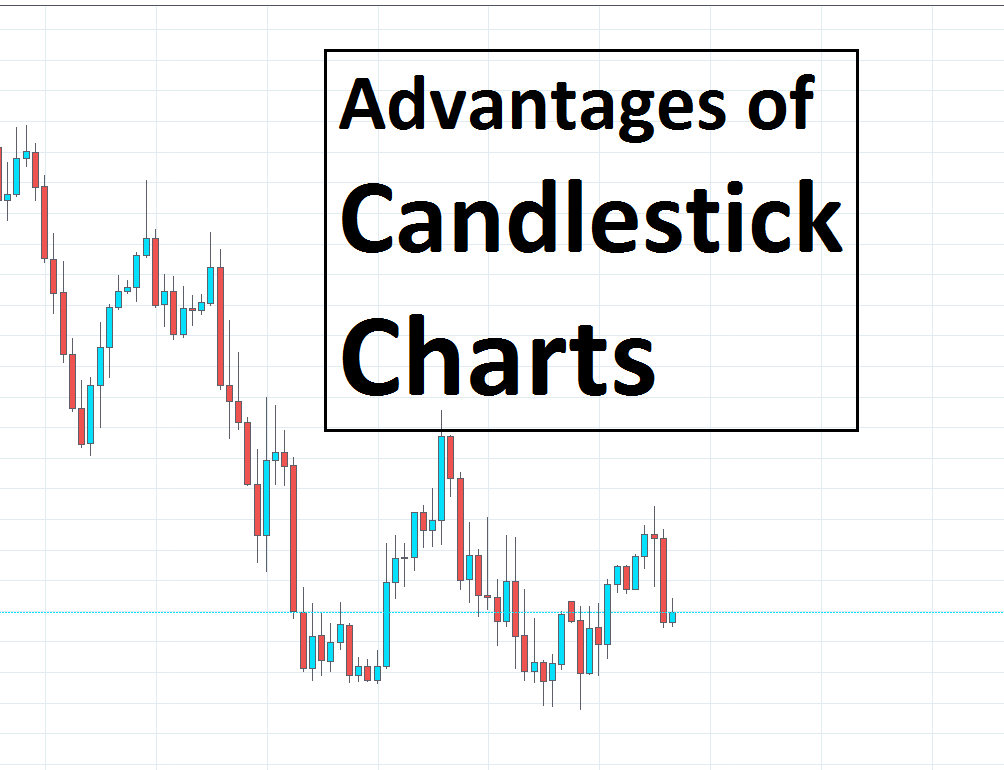
Traders have started to use candlestick charts even more often than any other technical analytics tools in the last few decades. Candlestick charts in Forex have such a clear, easier-to-analyze look, and give more comprehensive market details at a glance than bar charts or line charts. Candlestick charts are the technical tool that packs data into specific price bars for multiple time frames. This makes them much useful than conventional open-high-low-close bars or basic lines that connect the closing price dots.
Perhaps the most common type of chart is the candlestick chart. The candlestick chart has proven useful in explaining market price fluctuations for the forex market, reserve, futures, and commodities traders. It shows all applicable market price levels over a trading period. A trader is able to know the opening/closing prices and the high/low points in the forex markets during that trading period on a candlestick chart, and thus know the current market sentiment. We are pleasing visually.
The major benefit of candlesticks chart patterns is that they offer an easy-to-read method for traders to track any fluctuations in supply and demand that may occur. Traders may find some evidence of any trend reversals in the time simply by using the candlestick chart trends to conduct crucial day analysis. It acts as an early warning for traders as to how the market is going. Using in conjunction with other tools and market indicators, Candlesticks will offer a lot of opportunities for trading to the traders to benefit.
When evaluating the options that are presented, candlestick charts in Forex can be the most useful tools. A forex trader can achieve significant advantages in forex market decision-making by learning how to read and use these candles. Conversely, a candlestick chart will inform you what a bar chart does and give you a graphical representation of the duration between an opening and the closing time. You will make well thought out and informed decisions with the knowledge in hand.
In order to read prices, Forex traders need a candlestick chart because they’re a feature of supply and demand and are subject to several factors apart from prevailing economic conditions. Like well as other human emotions such as greed, anger, fear, or even hysteria, prices are also influenced by fundamental influences. Such emotions also carry drastic price changes. Most of the market moves aren’t necessarily based on reality but on hopes. Candlestick trends can be a useful predictor of potential trend reversals and market price breakouts when used in combination with other methods of analysis, helping you create a stronger and more efficient forex trading strategy.

Welcome to my author blog. With over 12 years of experience in the financial markets, Trading is more than a profession for me; it's a passion that has fueled my curiosity and determination. Over the years, I've explored various trading strategies, dabbled in different asset classes, and navigated through the ever-evolving landscape of technology and innovation. Through it all, I've witnessed firsthand the transformation of the financial industry. My mission is to share the wealth of knowledge I've gained over the years with you, my fellow traders and aspiring investors. Whether you're a seasoned pro looking for fresh perspectives or a newcomer eager to understand the basics, you'll find something valuable here.


Get 15% off on any item when you buy today