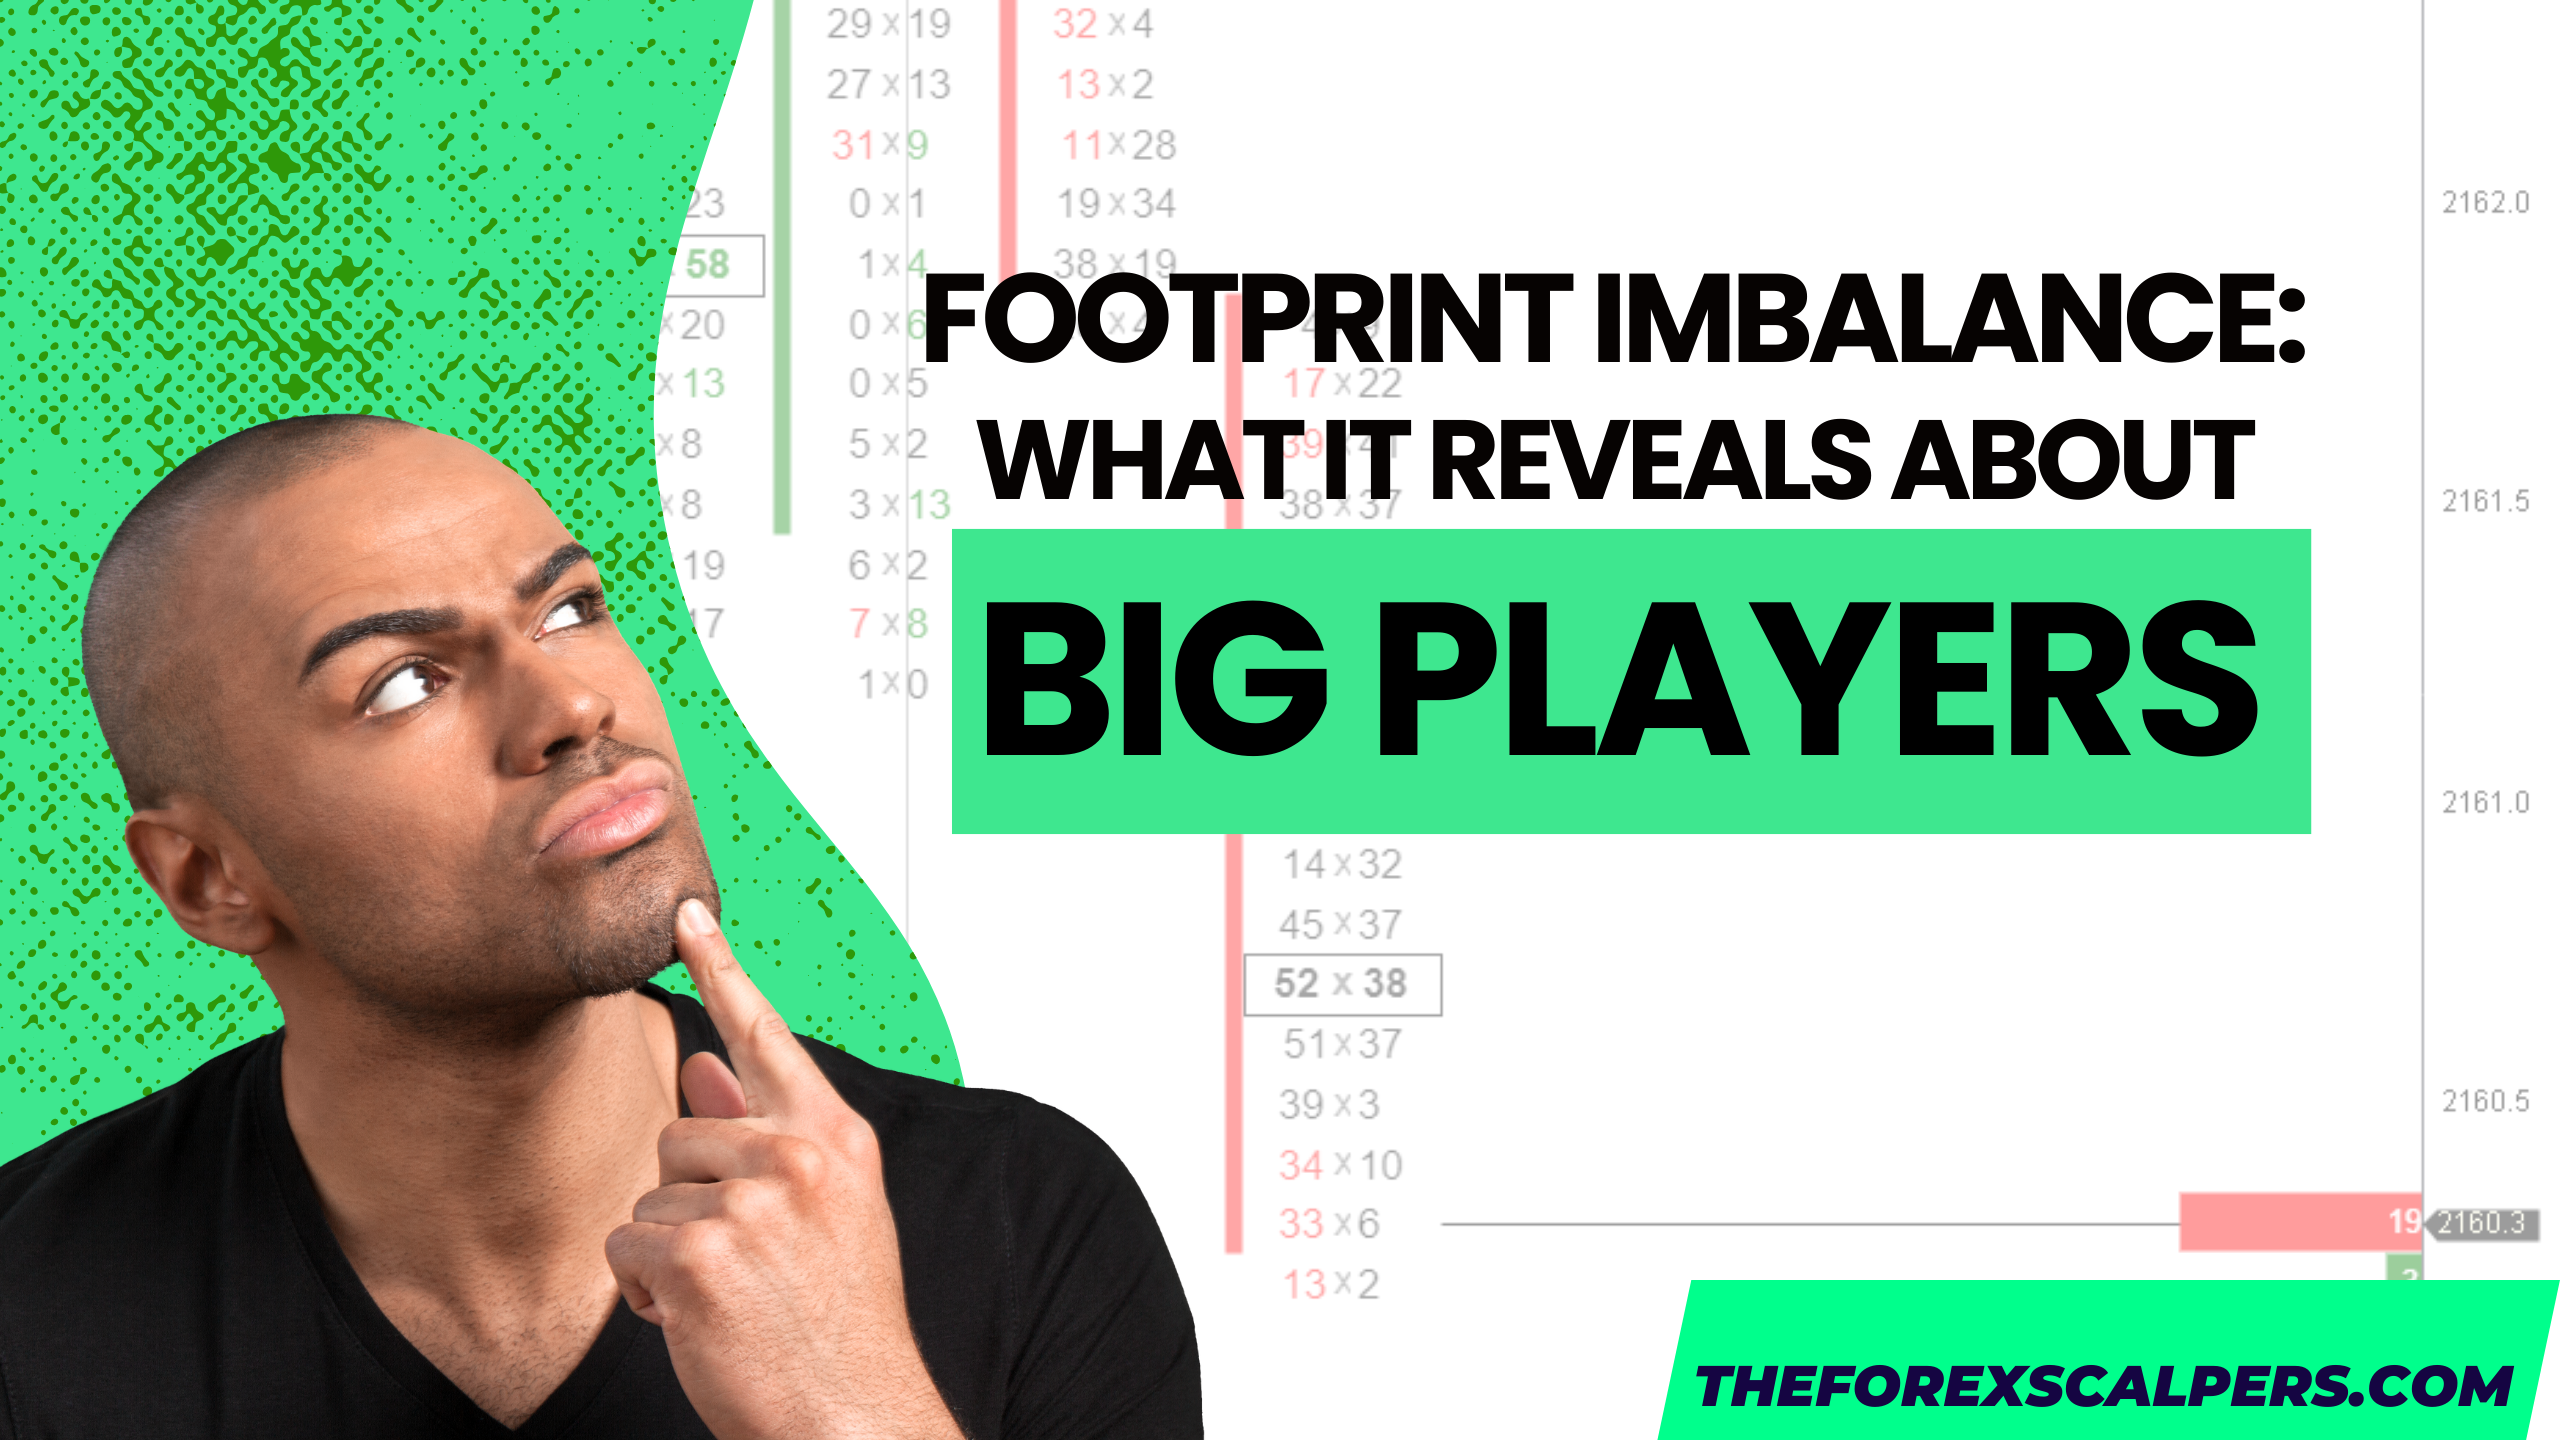
Footprint imbalance
In trading, success often hinges on one thing: information. The more you know about what’s happening in the market right now, the better your decisions. This is where footprint charts come in—a tool that gives you a deeper look into market activity, exposing the battle between buyers and sellers like nothing else can.
But let’s be real: most traders don’t even know these charts exist, let alone how to use them. If you’re tired of feeling one step behind the market and want to trade with precision and confidence, footprint charts might just be the game-changer you need.
What Are Footprint Charts—and Why Should You Care?
Imagine being able to see exactly what’s happening inside each price candle. While traditional charts only show you open, high, low, and close prices, footprint charts unlock the hidden data within each candle. They reveal the volume of buyers versus sellers at every price level—essentially showing you where the real action is taking place.
This isn’t just another shiny trading tool. Footprint charts let you:
- Spot key imbalances in the market.
- Identify volume clusters where the big players are active.
- Understand the battle between supply and demand in real-time.
For traders looking to level up their game, this is pure gold.
Do Footprint Charts Actually Work?
You’ve probably seen dozens of tools claiming to “revolutionize” trading, so let’s address the elephant in the room: do footprint charts actually work?
The answer is a resounding yes—but only if you know how to use them. Footprint charts give you an edge by showing what’s happening under the surface. They work because they’re rooted in order flow—the raw buying and selling data that moves markets.
For example, let’s say you’re trading Nasdaq futures. A quick glance at your footprint chart might reveal a cluster of aggressive buying at a key level. This isn’t just noise; it’s a signal that buyers are dominating, and the price is likely to push higher.
With footprint charts, you’re no longer guessing. You’re making decisions based on hard data.
Where to Get Footprint Charts / footprint imbalance
Now that you’re intrigued, you’re probably wondering: where can I get these magical charts? Good news: they’re more accessible than ever.
Popular platforms like Thinkorswim (TOS), ATAS, Sierra Chart, and NinjaTrader all offer footprint charting tools. However, not all platforms are created equal. If you’re serious about using footprint charts, look for software that provides:
- Detailed volume and delta data.
- Customizable chart settings.
- Seamless integration with your trading strategy.
Want to dip your toes in? Start with ATAS it’s beginner-friendly and packed with features for footprint charting.
How to Read Footprint Charts
Here’s where things get fun. Reading footprint charts isn’t rocket science, but it does require some practice.
At their core, footprint charts show two key elements:
- Volume: The number of contracts traded at each price.
- Imbalances: When aggressive buyers or sellers overwhelm the other side.
For example:
- A buy imbalance occurs when there’s significantly more buying than selling at a price level. This often signals upward momentum.
- A sell imbalance means sellers are dominating, potentially driving prices lower.
By spotting these imbalances, you can pinpoint high-probability trade setups. Combine this with key levels or order flow, and you have a strategy that’s hard to beat.
Using Footprint Charts to Crush Prop Firm Challenges / footprint imbalance
If you’re trading for a prop firm or thinking about it, footprint charts can be your secret weapon. Most prop firms have strict rules—profit targets, drawdown limits, you name it. To pass, you need precision, and footprint charts give you exactly that.
Here’s how:
- Trade aggressively but smartly: Use footprint charts to identify high-volume areas where big players are active.
- Catch reversals: Look for imbalances at key support or resistance levels.
- Stay ahead of the crowd: Use real-time data to anticipate market moves before traditional indicators catch up.
Prop firm challenges are designed to test your discipline and strategy. With footprint charts, you’re not just playing their game—you’re beating them at it.
Ready to Level Up? footprint imbalance
Footprint charts aren’t just a tool—they’re a competitive edge. Whether you’re trading forex, Nasdaq, or gold, understanding market imbalances can transform your results.
Curious to learn more? Join Element 88 and discover the secrets to crushing prop firms while mastering tools like order flow and footprint charts.
Or if you want to start with the basics of footprint charts and order flow, check out The Whale Order—your first step to trading smarter, not harder.
The markets are waiting. Are you ready to make your move?
Join us
Joining our community opens the door to a network of enthusiastic traders, all focused on mutual success. Our exclusive members-only Discord is your arena for exchanging ideas, dissecting market trends, and fostering collaborations. That can turn trading visions into reality.
Don’t let another moment pass in hesitation. Embark on your journey to trading excellence today by enrolling in our courses. It’s time to transform your trading dreams into your reality.
Join our courses and community today and take your skills to the next level!
Elevate Your Trading with ATAS.
So for those dedicated to mastering the art of trading. ATAS is more than a platform. It’s a partner in your journey towards trading excellence. Its blend of sophisticated analysis tools, customizable features, and supportive community. This makes ATAS the recommended choice for traders aiming to leverage the full potential of the futures market.
Looking for a Trusted Regulated Broker?
TheForexScalper recommends you join ICMARKET which is regulated and the most trusted broker.
They provide very tight raw spread account with fast execution and having multiples deposit and withdrawal options.


