What is a Head and shoulders pattern?
What is a Head and shoulders pattern?
Price Action moves all time and no movement is the same. The following patterns are most common at the charts. Let’s learn how to look at them and how to use and combine their specific rules with other aspects of our technical analysis.
Techniques:
This head and shoulders patterns shown is a signal that indicates a certain pair is a setup to go down and repeat the same pattern. Mostly seen at the highest point of an upwards trend. Off course there is a second version as with a lot of techniques and patterns. Since we have to see the market as a big mirror. Everything that happens on the upside can occur on the downside as well. The second version is known as the head and shoulder bottom or reversed head and shoulders. The reverse head and shoulders patterns are simply the opposite the normal head and shoulders pattern and indicate a certain pair will move up and repeat the same pattern. Both times, the head and shoulders suggest a reverse meaning the pair will move against the ongoing trend.
The Neck:
Both of the head and shoulder patterns have a likewise construction. Four compounds will make the head and shoulder pattern complete: Two shoulders, a head, and a neck.
The pattern confirms a trade setup at the beginning of the neck/trend line, after the second shoulder has been formed.
For example A period of consecutive upwards highs and retracements is seen as an uptrend, while a downtrend consists of consecutive lower peaks and pullbacks.
The head and shoulder pattern illustrates the weakness of a certain trend.
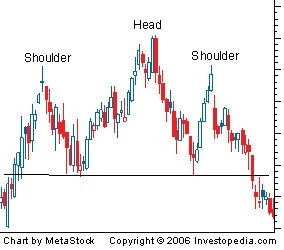
Head and shoulders above:
– This pattern consists of four consecutive steps completing themselves to signalize the reverse.
– Left shoulder is formed when a pair reaches a new high and retraces to a new low.
– The head is formed when a pair reaches a new higher high and falls back around the level of the low formed at the left shoulder.
– Right shoulder is formed with a high a little lower than the high formed at the head. And again followed by fall back around the same low formed at the left shoulder.
– The Price breaks the neck/trend line. In other words the price drops under the Support and flows towards the level of the three lowest points before breaking through the head and left shoulder.
Head and shoulders bottom (Revearsed h&s):
The reverse head and shoulder pattern is the exact opposite of the head and shoulder top, because it indicates the pair is setup to make an upwards move.
– Left shoulder is formed when a pair reaches a new low and pull back to a new high.
– The head is formed when a pair reaches a low that is lower than the low of the left shoulder and will pull back to the level of the around the latest high. This step towards the past high will create the neck for this pattern.
– The right shoulder is formed by a typical sell-off and is less bad as the low of the head. Followed by a pullback to the neck.
– The pair breaks above the neck/ trend line. The pattern is completed when the price above the neck breaks and creates an uptrend.
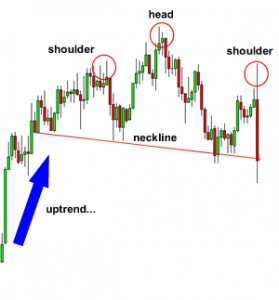
After the fourth step, when the neck is broken. The pair will most certainly move towards a new direction. It is that specific point that traders use to step in and open up a position.
The head and shoulders patterns are formed by three characteristics and can be spotted at multiple time frames. This setup achieves best results at the daily and H4 charts.
How to spot a formation:
Left shoulder: Going on trend has to be Bullish, with a price anticipating on the next movement at an important Resistance level. The Price action is often a bearish candlestick, as a catalyst for a deep pullback.
Head: Next wave will keep on going up till it reaches a new high before it forms a Bearish reversal. This peak is the highest point of this pattern.
Right shoulder: At the end, the price will move up a bit again. However, this time i won’t get higher as the head (past high).
What to do when Head and Shoulders occur?:
Once we’ve concluded the head and shoulder patterns is at the “neck” phase it’s now possible to predict a Bearish break out.
Reversed Head and shoulders:
The last shown pattern can also occur in a reverse aspect. Same rules are applied and it doesn’t matter if the state of the market is Bullish or Bearish. As long as you see the pattern and wait till the neck is broken to step in your good.
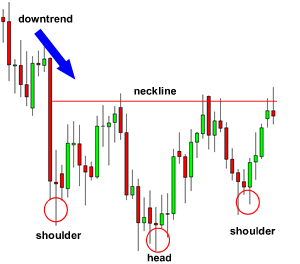
Once you’ve decided to setup a long term position, your Stop-loss has to be placed around the level of the right shoulder. Just like you’ve calculated the target level on the head and shoulder pattern, you should now measure the distance between the low of the head and neck. Don’t forget to duplicate it in the breakout point.
Underneath a clear example of the reverse head and shoulder formation.
Best Broker: IcMarkets.
