Learn everything about Orderflow trading?
- theforexscalper
Learn everything about Orderflow trading?
theforexscalper
Email us now :
info@theforexscalpers.com

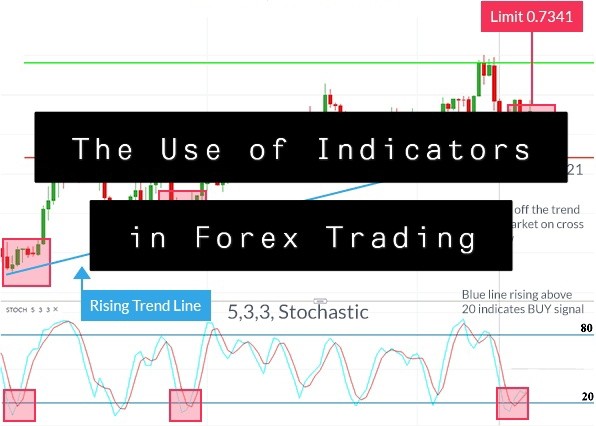
Technical analysis is the study of historical price behavior to determine charts and probabilities of future movements in the forex market that are used by technical analysts to help analyze price data and produce tradable buy and sell opportunities using technical studies, indicators, and other analytical tools. For savvy Forex traders who know how to use them when trading the market, foreign exchange indicators and charting software can be of great help for some traders.
Technical indicators are mathematical calculations that use historical price action and volume to predict future price movements, providing signals of trade. Such signals indicate a possible time and price for a trader to enter a trade, to take advantage of the forecast price change. Technical indicators are typically shown above or below price charts to help FX traders recognize trends and conditions where they are overbought or oversold.
Using technical analysis enables you to identify bound range or trending environments as a Forex trader, and then find higher chances entries or exits based on their readings. It is as simple to understand the indicators as to put them on the chart. Understanding how to use each of the four indicators, such as the Moving Average, RSI, Slow Stochastic, and MACD, would provide a clear method for recognizing trade opportunities for traders.
Understanding when a trade is to be opened or closed is key to successful forex trading and a major part of learning how to trade pairs. Note, there is no perfect mix of technical indicators to unlock some form of secret trading strategy. Good risk management, discipline, and able to handle your emotions are the secret to successful trading. Anybody can guess right and win every once in a while but it’s nearly impossible to remain successful over time without risk management.
======================
Results – Instagram
======================

Welcome to my author blog. With over 12 years of experience in the financial markets, Trading is more than a profession for me; it's a passion that has fueled my curiosity and determination. Over the years, I've explored various trading strategies, dabbled in different asset classes, and navigated through the ever-evolving landscape of technology and innovation. Through it all, I've witnessed firsthand the transformation of the financial industry. My mission is to share the wealth of knowledge I've gained over the years with you, my fellow traders and aspiring investors. Whether you're a seasoned pro looking for fresh perspectives or a newcomer eager to understand the basics, you'll find something valuable here.


Success in trading isn’t just a dream — it’s achievable,
and in just 6 weeks, you can be well on your way to becoming a funded trader or growing your own capital.
What’s holding you back from turning your effort into results?
If you’re ready to commit, you’ll have the building blocks you need for real success.
Take the leap, and let’s make it happen together!
Get 15% off on any item when you buy today