Learn everything about Orderflow trading?
- theforexscalper

Footprint chart
The basic concepts of the footprint chart, and why to use this chart. In combination with delta and real volume.
There are several advantages within the footprint chart, See here
the top 3 advantages of the footprint chart order flow and its use.
1. The Footprint chart gives you a deep insight into transaction volume in real markets in every time frame.
2. This analysis gives you insight into Ask and Bid. The interaction between Buying & Selling.
3. A strategy that clearly indicates in data especially the delta shifts and high volume nodes and around the trading market sessions open.
Also to be able to determine which imbalance in price is correct and which one to avoid. The footprint chart gives you an unprecedentedly clear picture, I will give an example below in S&P500. In addition to Nasdaq NAS100, one of my favorite pairs to trade in the New York trading session NYSE.
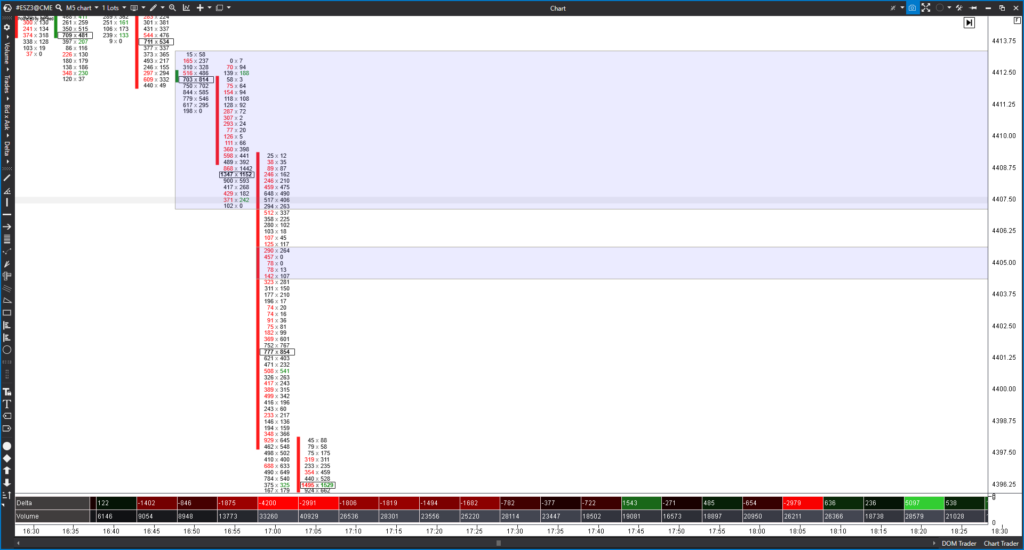
In this top example we see a drop in price with a clear imbalance left in price. We can validate this on the footprint chart using the delta volume & imbalance in price.
When we look back at a New York market opening, we see that it looks interesting. But now we see it purely from a technical eye point, let’s put the footprint next to it?
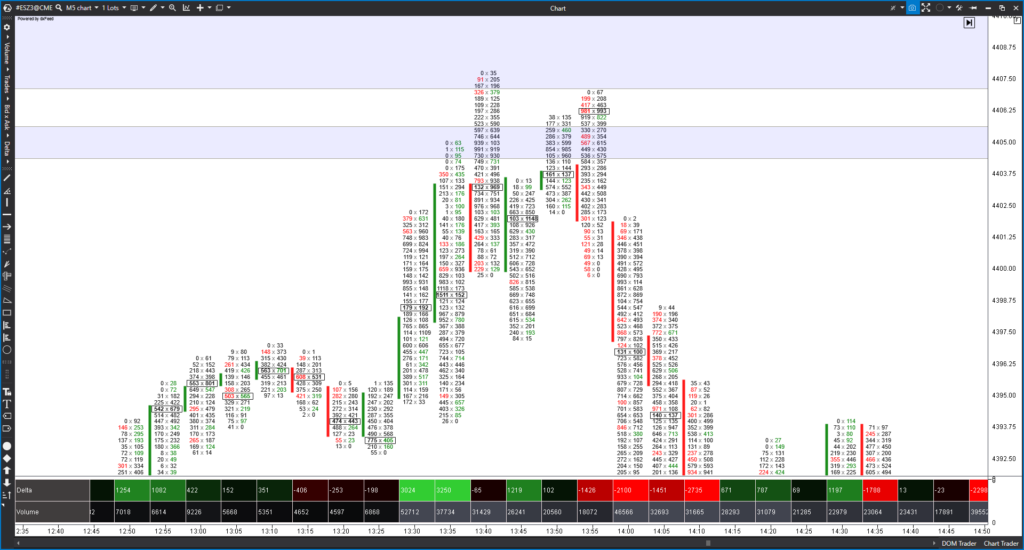
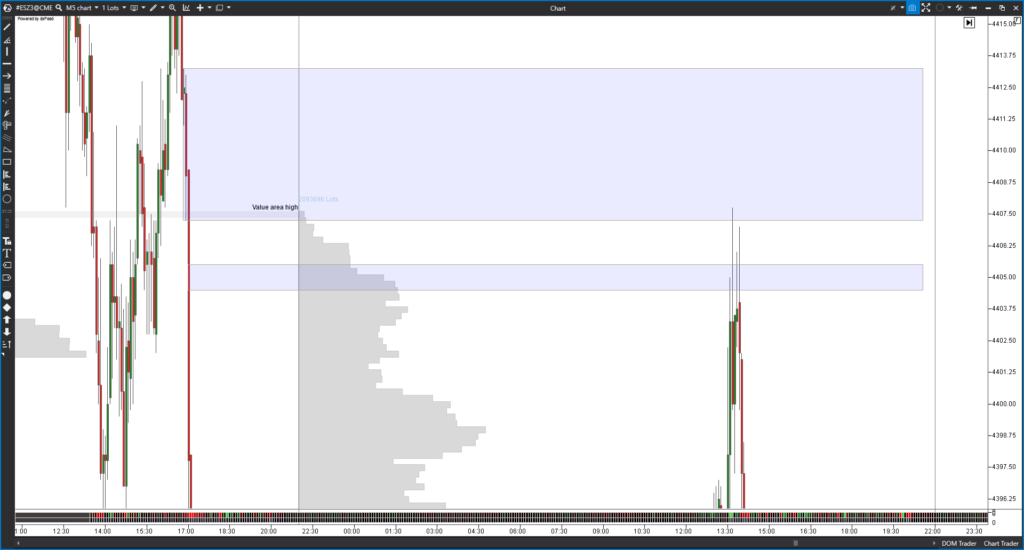
Now it’s getting interesting, we have a lot of sellers to appear at the moment. Price liquidity grabs its in its highest point of that day, EQL highs, value area high. We also see the volume increasing and the delta changing from buying to selling, everything indicates that this is the turnaround, from bid to ask.
I call them sellers on the ask in a scenario as explained above!
The purest form that we can see as a retail trader, raw data order flow is discussed her. And our odds are suddenly much greater than if we focused purely on a technical chart.
how to analyze the order flow chart and use the footprint.
– Seeing real imbalances in price versus bid & ask,
This is the most common type of footprint chart. The Bid/ask footprint displays. The number of contracts traded on the bid versus ask
– The high volume nodes, the high volume nodes show you where buying or selling stops. Or where it starts again, being able to anticipate this from minute to minute on the footprint charts.
– Volume Profile – The Volume footprint shows a total number of contracts traded at each price point. This can be very valuable for showing price levels where there is interest from buyers and sellers footprint chart.
– Delta footprint, the delta is usually very clear and can be read very straight forward. The delta shows the difference between complete orders on the bid and offer for a particular price. This can also be clearly seen in the last picture above how the delta starts to change when the price hits a major level of imbalance.
I hope that this brief explanation was clear and provided clarification to understand the basic elements of the footprint chart.
If you want to learn more about the footprint chart, I recommend that you take thewhaleorder course, I will give you a 5% discount for reading this article.
With the code: orderflowtrading
Wish you the best, salute Kev.
Are you looking to take your trading skills to the next level? Or want to know more about Order flow analysis software?
Look no further!
Our comprehensive trading courses and dynamic community provide the resources and support you need to succeed in the financial markets.
Our experienced instructors will guide you through the fundamentals of trading and help you develop a personalized strategy that suits your goals and risk tolerance.
By joining our community, you’ll have access to a network of like-minded traders who are dedicated to helping you achieve your goals.
Our members-only slack provide the perfect platform to exchange ideas, discuss market trends, and collaborate on trades.
Don’t wait any longer to start achieving your trading dreams.
Join our courses and community today and take your skills to the next level!
TheForexScalper recommends you join ICMARKET which is regulated and the most trusted broker. They provide very tight raw spread account with fast execution and having multiples deposit and withdrawal options.


Welcome to my author blog. With over 12 years of experience in the financial markets, Trading is more than a profession for me; it's a passion that has fueled my curiosity and determination. Over the years, I've explored various trading strategies, dabbled in different asset classes, and navigated through the ever-evolving landscape of technology and innovation. Through it all, I've witnessed firsthand the transformation of the financial industry. My mission is to share the wealth of knowledge I've gained over the years with you, my fellow traders and aspiring investors. Whether you're a seasoned pro looking for fresh perspectives or a newcomer eager to understand the basics, you'll find something valuable here.


8 Replies to “Footprint chart / How to read orderflow?”