Learn everything about Orderflow trading?
- theforexscalper

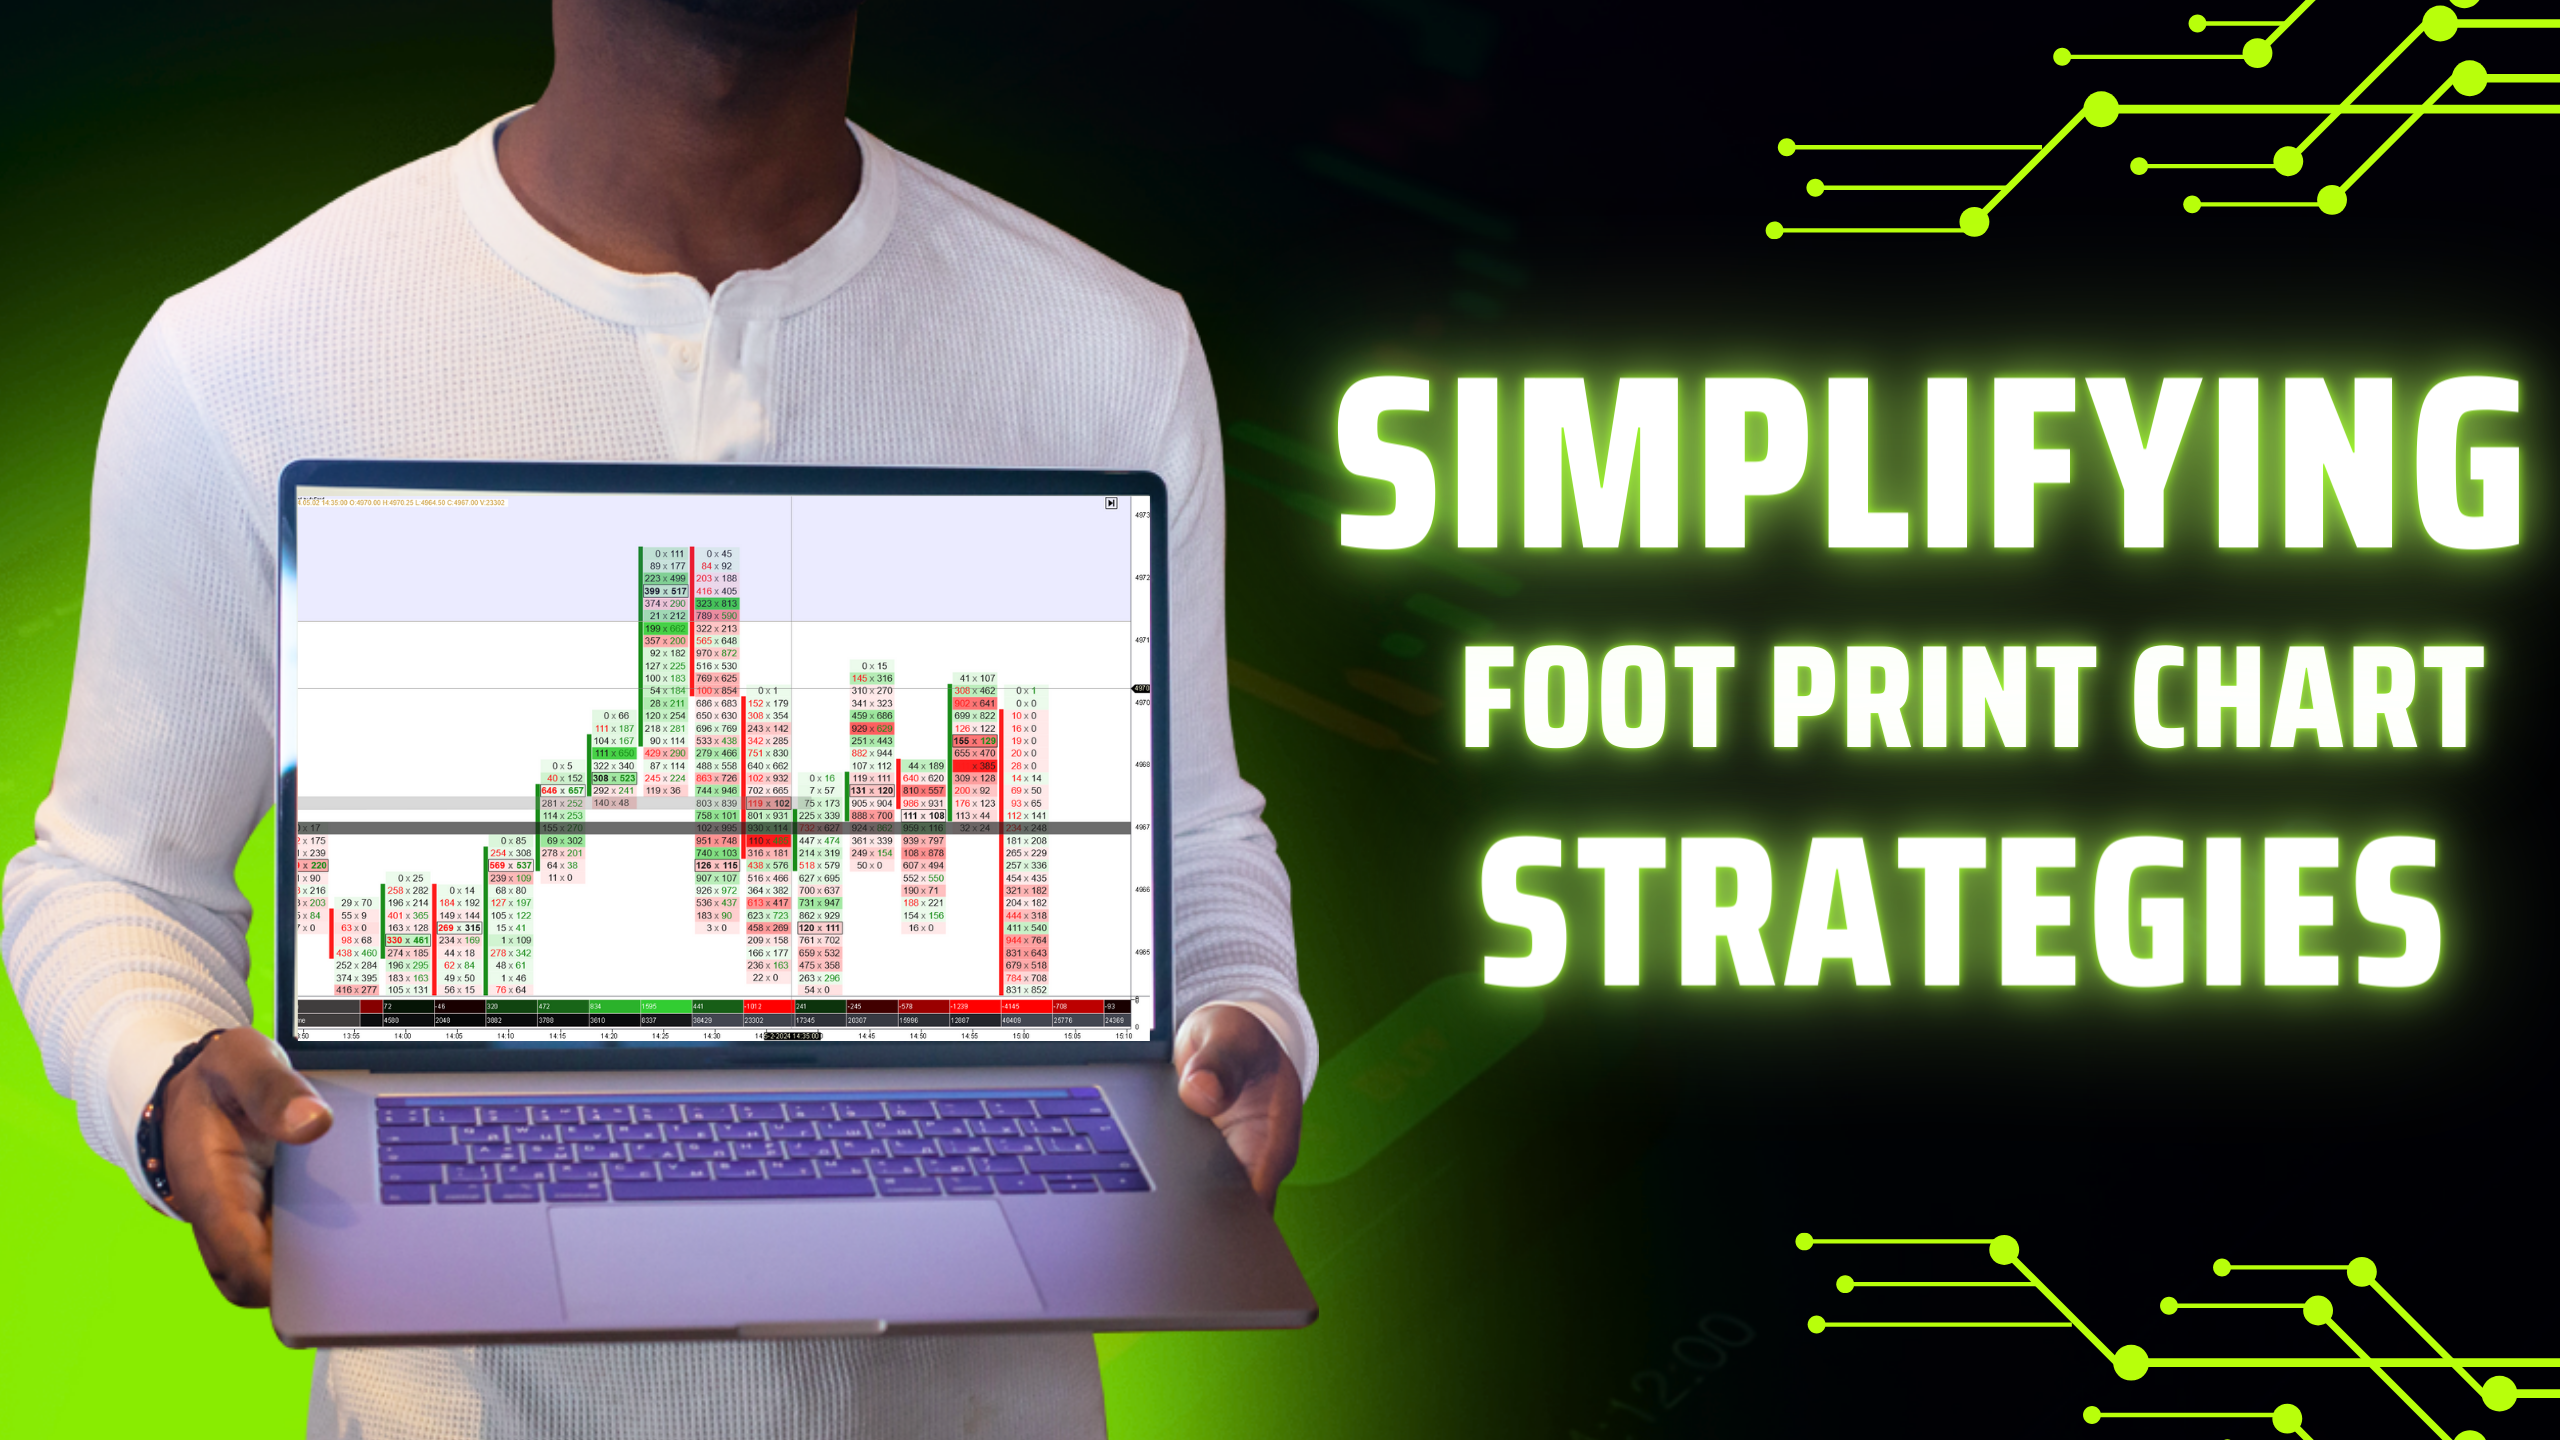
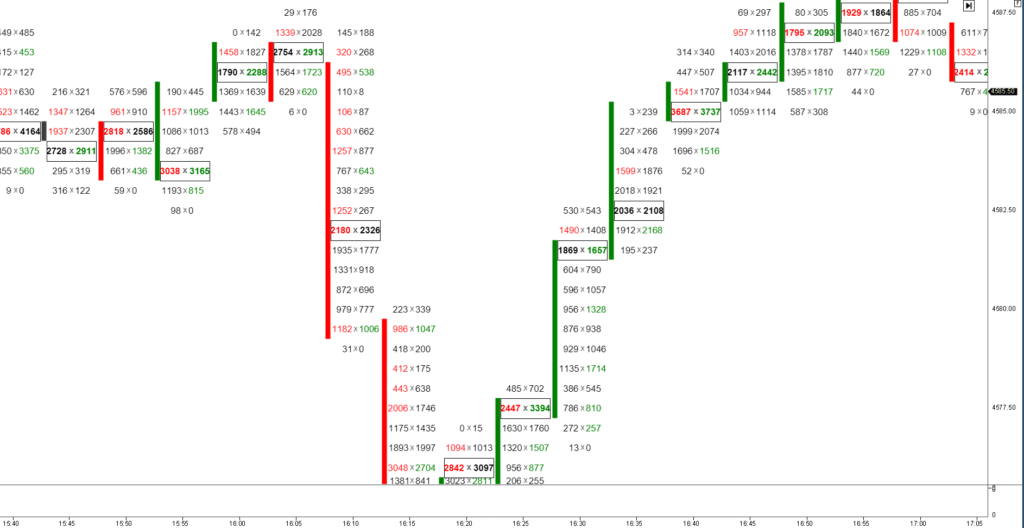
foot print chart
In trading, having tools for better understanding market dynamics is extremely valuable in the ever-changing world. Orderflow charts emerge as a revolutionary tool, offering traders a granular view of market activity beyond traditional price movements. This guide shows how footprint charts help find market trends, support and resistance levels, and make accurate trading choices.
Footprint charts are a type of financial chart that provide a detailed view of market activity. They are often used in trading and investing to study buying and selling pressure in a specific time.
The main feature of a footprint chart is the visualization of the volume at each price level. This is represented by a series of bars or blocks that are stacked vertically. Each bar or block represents a specific price level, and its height indicates the volume traded at that price.
The width of the bar or block shows how long we collected the volume. Traders can find high and low volume areas by looking at the footprint chart. Busy areas show lots of buying or selling, while quiet areas mean people aren’t interested or can’t decide. You can also see that on the market orders.
This data helps identify Supply and Demand levels, and areas where prices remain stable or change quickly. This data helps identify support and resistance levels. It also helps identify areas where prices remain stable or change quickly.
Foot print chart show other important market data unlike the candlestick chart. This includes the start and end prices, as well as the highest and lowest prices for the analyzed time. This allows traders to assess the overall price action and volatility within the market.
You can use footprint charts for analyzing trades in different strategies like scalping, swing trading, and trend following. You can also use charts to make informed decisions about trade timing, risk management, and profit targets.
Charts helps us traders to determine the optimal entry and exit points for trades. Additionally, charts enable us to assess and manage the level of risk associated with a trade. We can also use charts to set specific profit goals for our trades.
Charts are useful for us traders to make decisions. Regular trading platforms do not commonly have footprint charts or orderflow analysis tool. So often we need to use specialized software or platforms that offer this type of charting functionality. However, with the increasing popularity of footprint charts, some trading platforms are starting to incorporate them into their offerings.
Overall, footprint graph charts provide a unique and detailed perspective on market activity. They help us understand the relationship between buyers and sellers and find trading opportunities. By incorporating footprint charts into analysis, you can gain a competitive edge in the financial markets.
Technical analysis and Delta footprint charts, unlike their traditional counterparts, do not merely track the price over time. Instead, they offer a detailed view of the volume of trades executed at specific price levels and time frame. This approach provides information on people’s preferences and the availability of products at various prices. It also offers insights into market sentiments and potential future developments.
These order flow footprint charts ground themselves in time and sales data, capturing every transaction in the marketplace. Each ‘footprint‘ on the chart corresponds to a specific price level and the volume of trades executed at that level. This tool shows traders the price and volume of market movements, giving them information about the strength or weakness of trends.
Free footprint charts can analyze volume distribution at various price levels. This shows areas where buying or selling pressure concentrates, indicating potential supply or demand levels. A large footprint with significant volume might signal strong buying interest, pointing to a robust supply level. Conversely, a footprint with minimal volume could indicate a lack of demand, suggesting a demand level.
Traders like to use price by volume analysis to find important price levels with high trading volumes. Merging this approach with footprint charts enriches a trader’s understanding of market sentiment, enabling more accurate forecasts. A clear chart with high volume shows an important price level, acting as a guide for strong support or resistance.
A trader sees a big graph showing many people wanting to buy at a certain price. This observation suggests a strong support level, presenting an opportune moment to initiate a long position. The trader can use the footprint chart to set a stop-loss order just below the support level to manage risk.
Footprint charts show more than just price and volume data. They tell a story about how the market behaves, showing the battle between buyers and sellers. Traders use charts to find strong or weak areas in the market based on significant trading volumes. Footprint charts are a powerful tool for traders, helping them navigate the complexities of the market when used wisely.
While the primary utility of footprint charts lies in analyzing volume and price levels, their application extends further. Traders can employ these charts to:
The digital age has democratized access to advanced trading tools, including footprint charts. Numerous online platforms now offer sophisticated analyzing software, some even providing free access to basic footprint charting functionalities. Traders of any level can easily utilize these powerful tools in their trading strategies. This helps to create a fairer and more competitive trading field.
Having tools for understanding market dynamics is valuable in the ever-changing trading world.
The best foot print chart software i use is ATAS. They have a good and easy to use footprint indicator.
Having a visual representation is best for your order flow analysis.
If you subscribe to this link you get a two week footprint chart software free from ATAS.
Joining our community opens the door to a network of enthusiastic traders, all focused on mutual success. Our exclusive members-only Slack channel is your arena for exchanging ideas, dissecting market trends, and fostering collaborations. That can turn trading visions into reality.
Because we don’t stop there. For those ready to take a significant step forward, we invite you to explore the opportunity with our proprietary trading firm. TFS Funding. This platform is designed for traders who are eager to leverage their skills on a larger scale. O ffering the capital and support needed to flourish in the markets.
Don’t let another moment pass in hesitation. Embark on your journey to trading excellence today by enrolling in our courses, engaging with our community, and seizing the opportunity with TFS Funding. It’s time to transform your trading dreams into your reality.
Join TFS Funding Here – Unlock the door to advanced trading opportunities and elevate your skills to the professional level with TFS Funding.
Join our courses and community today and take your skills to the next level!
Elevate Your Trading with ATAS.
So for those dedicated to mastering the art of futures trading, ATAS is more than a platform. It’s a partner in your journey towards trading excellence. Its blend of sophisticated analysis tools, customizable features, and supportive community. This makes ATAS the recommended choice for traders aiming to leverage the full potential of the futures market.


Welcome to my author blog. With over 12 years of experience in the financial markets, Trading is more than a profession for me; it's a passion that has fueled my curiosity and determination. Over the years, I've explored various trading strategies, dabbled in different asset classes, and navigated through the ever-evolving landscape of technology and innovation. Through it all, I've witnessed firsthand the transformation of the financial industry. My mission is to share the wealth of knowledge I've gained over the years with you, my fellow traders and aspiring investors. Whether you're a seasoned pro looking for fresh perspectives or a newcomer eager to understand the basics, you'll find something valuable here.